Accounting Reports Overview
Last updated: Jun 17, 2026, 2:37 PM
- About Accounting Reports
- Value and Use Cases
- Required Modules, Permissions, and Access
- Navigate to Accounting Reports
- The Four Accounting Reports
- How GL Codes Shape Your Totals
- Known Limitations
- Related Articles
About Accounting Reports
Accounting Reports give you a level of custom reporting in Toast Web. You create general ledger (GL) codes, map them to sales data points in Toast, and pull a single report built from your selections.
These reports help you review key financial information for a date range and prepare entries for external accounting software, such as QuickBooks. Restaurants often use them to record daily sales and track daily journal entries in one place.
Value and Use Cases
Accounting Reports answer questions that otherwise require pulling several separate reports. Common uses include:
- Reviewing key financial numbers for an end-of-year review or any custom date range.
- Seeing cash and credit card deposits together in one report.
- Tracking daily journal entries for entry into external accounting software, like QuickBooks.
- Breaking out sales, taxes, and discounts by sales category, dining option, or revenue center.
Required Modules, Permissions, and Access
Accounting Reports are part of reporting in Toast Web. To view them, you need a Toast Web account with access to the reporting area.
GL codes are optional for some reports and required for others. The Accounting by Day and Accounting by Location reports rely on GL codes, so you only see meaningful data in them after you create and map your GL codes.
Note: GL codes and their mapping are set per location. A newly live location does not show GL data until its GL accounts are created and mapped for that location.
Navigate to Accounting Reports
In Toast Web, navigate to Reports. Using the reports navigation on the left side of the screen, select Accounts to open the drop-down, then choose the report you want to view.
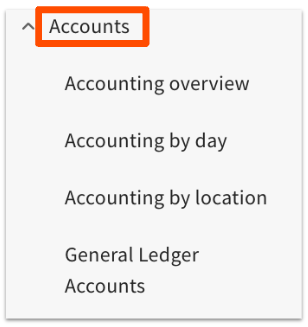
The Four Accounting Reports
The Accounts drop-down contains four reports. Each serves a different reporting need.
| Report | What it shows | When to use it |
|---|---|---|
| Accounting Overview | An overview of key financial information, including third-party delivery payment types. | End-of-year reviews and general financial review. |
| Accounting by Day | A breakdown of revenue by GL code for each day in the report range. | When you use GL codes and want a daily export for your accounting software. |
| Accounting by Location | A breakdown of revenue by GL code for each location in the report range. | Multi-location restaurants tracking daily journal entries across locations. |
| General Ledger Accounts | The setup page where you create and map your GL codes. | When you need to create, edit, or map GL codes. |
Accounting Overview
The Accounting Overview report lets you view and print an overview of your key financial information. It is helpful for questions such as which items collected no tax that were not tax exempt, what percentage of business is third-party delivery, dine-in versus takeout share, tax paid per tax rate or sales category, and a breakdown of each discount.
After you select Accounting Overview from the left-hand reporting menu, choose a date range. If you have more than one location, select the locations to include. After you select Submit, the report opens.
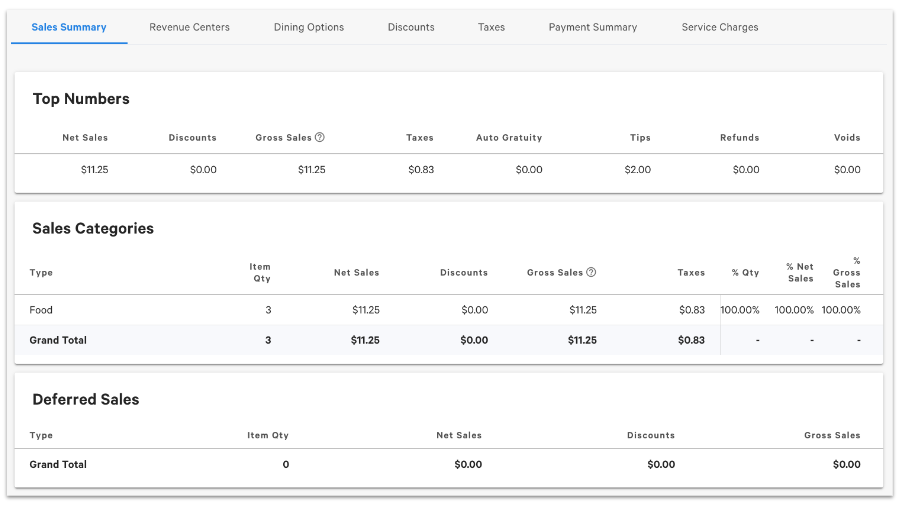
The report includes these tabs:
- Sales Summary: Your key sales numbers, grouped by Sales Top Numbers, Sales Categories, and Deferred Sales.
- Revenue Centers: Sales numbers by revenue center.
- Dining Options: Sales by dining option, such as Dine In, Take Out, Employee Meal, and Delivery.
- Dining: All discounts used.
- Taxes: An overview of your taxes.
- Payment Summary: A summary of payment transactions.
- Service Charges: A summary of service charges applied.
The Sales Summary tab gives you quick, generalized information. Check the other tabs at the top for additional ways to view your financial data.
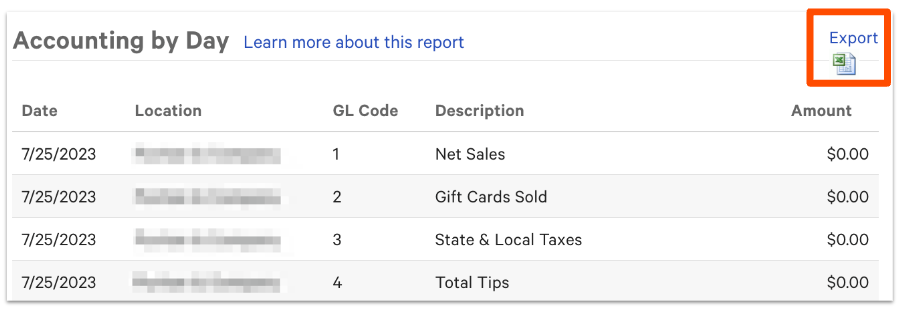
Accounting by Day
The Accounting by Day report provides a breakdown of revenue by GL code for each day within the report range. You can export it directly to Excel or another spreadsheet program using the icon in the top-right corner.
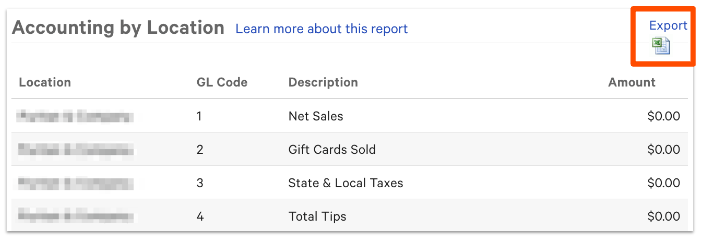
Accounting by Location
The Accounting by Location report provides a breakdown of revenue by GL code for each location within the report range. You can use it to combine information that you would otherwise pull from several separate reports. For example, you can set it up to show both your cash deposit and your credit card deposit in one place.
This report is typically used by accountants and bookkeepers to track daily journal entries in one place, which helps when making entries into external accounting software, like QuickBooks.
General Ledger Accounts
Selecting General Ledger Accounts takes you to the Accounting Report Setup page in Toast Web, where you create and map your GL codes. For full setup steps, see Create and Map General Ledger Codes for Toast POS.
How GL Codes Shape Your Totals
GL codes categorize the types of financial transactions your business performs. On the Accounting Report Setup page, you map Toast entities, payment types, discounts, and service charges to your GL codes, which controls what data appears on your accounting reports and how it groups together.
Two points come up often when reviewing these reports:
- The Cash total. The Cash entity equals your Expected Cash Deposit from the cash management report: Cash Payments + Cash Collected + Cash In + (Cash Out) + (Pay Out) + (Tip Out). Cash on hand is not mapped, so cash reported here comes from shift reviews and declared cash rather than directly from cash sales.
- The Over/Short total. Any field that is not mapped to a GL code is rolled into the Over/Short section of your accounting reports. A large Over/Short figure often means an entity, such as refunds, tips, or a cash activity, has not been mapped.
Note: GL codes can be mapped by sales category, dining option, or revenue center. To see discounts, taxes, and sales by sales category in the Accounting Overview report, map your GL codes by sales category.
Known Limitations
- Toast cannot provide an exact breakdown of cash versus card sales by sales category, because a single order may include multiple payment methods.
- Accounting by Day and Accounting by Location show meaningful data only after GL codes are created and mapped. A newly live location shows GL data only after its GL accounts are set up and mapped.
- You do not need xtraCHEF to map GL codes. You can create and map GL codes in Toast Web and download reports to upload into your accounting software yourself. xtraCHEF offers a separate GL workflow if you want it.
- If you find an incorrect figure on an accounting report, use the Sales Summary, the Order Details report, and the Payments reports to locate the discrepancy. If you believe the discrepancy is in the credit card fees, contact Toast Customer Care.
Related Articles
- Create and Map General Ledger Codes for Toast POS
- View Refunds in Toast Reporting
- xtraCHEF: General Ledger (GL) Codes
- Match Toast Payroll Categories to Your Accounting System's GL Codes