Product Mix (PMIX) Report Overview
Last updated: May 28, 2026, 2:54 PM
Use the new PMIX report in Toast Web to gain enhanced insights and greater flexibility when analyzing menu performance.
- About the product mix report
- How to access the report
- Filter and display options
- Compare time periods
- Menu hierarchy and levels
- Percentage of total
- Columns and COGS data
- Report settings
- Known limitations
- Frequently asked questions
- Related articles
About the product mix report
The PMIX report gives you a detailed breakdown of what your restaurant sold — organized by menu, menu group, item, modifier, subgroup, and special requests. You can filter by date range, sales category, employee, order source, and item tag. You can also compare two time periods side by side to spot trends.
Who can use it: Any user with the 4.2 Menu Reports permission in Toast Web. For help assigning permissions, see Access Permissions Reference.
What you can do with the PMIX report:
- See which menus, menu groups, and items are driving the most revenue
- View modifier, subgroup, and size performance alongside item data
- Compare performance across two time periods
- Filter by employee, tag, sales category, and order source
- Export the report as an Excel file or .csv
Important: The PMIX report cannot be automatically emailed on a schedule. See Automatically Send the Product Mix Report by Email for the current status of this feature request.
How to access the report
In Toast Web, navigate to Reports > Menus > Product mix. If you see a Try the new version button at the top of the page, select it to access the updated features described in this article.
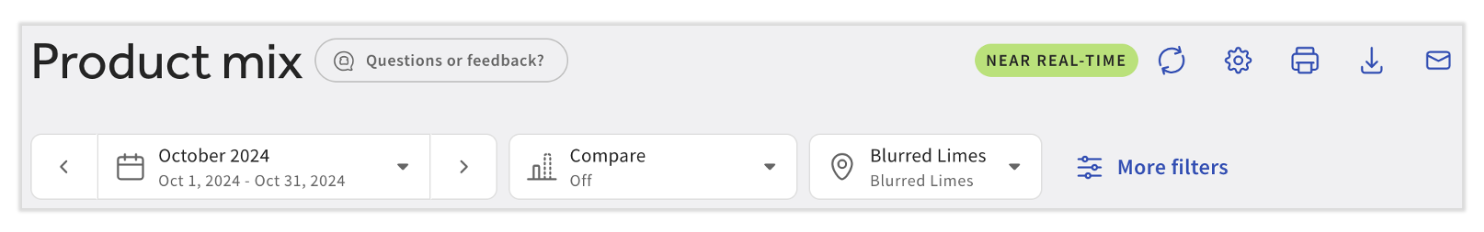
Filter and display options
At the top of the report, three drop-down menus control what data you see:
- Date range: Choose a preset (yesterday, this week, last month) or select Custom date to enter any range. There is no date range limit — you can pull data for a single day, a custom period, or more than a year.
- Compare: View two sets of data side by side for trend analysis. Off by default. See Compare time periods below.
- Location: Switch between restaurant groups and individual locations.
Select More filters to open an extended panel on the right side of the screen. Available filters include item tags, sales categories, employee, and order source. Select the v caret icon to choose a specific filter value, or select the pin icon to promote a filter to a top-level drop-down. Select Apply filters after making changes.
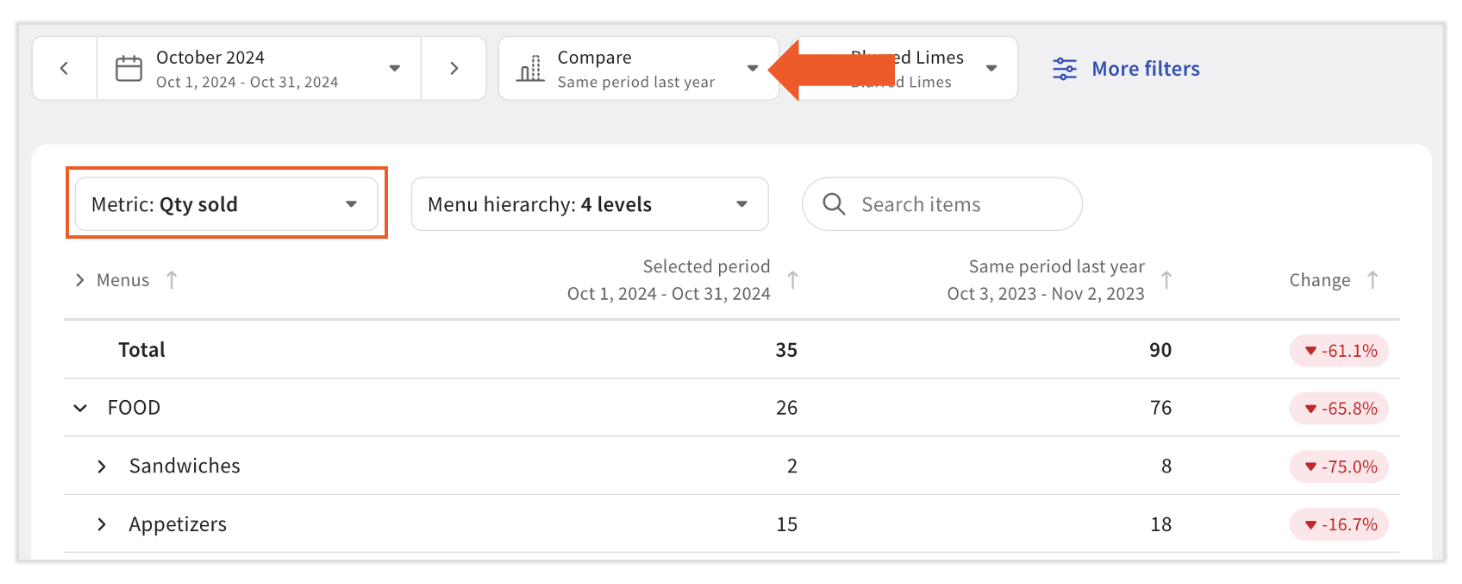
Compare time periods
The Compare drop-down (off by default) lets you view two time periods side by side. When you enable a comparison, a Metric drop-down appears above the table. Select one metric to compare across both periods.
Available metrics include: Qty sold, Gross item amount, Discount amount, Refund amount, Net item amount, Void amount, Waste count, Item price, Tax amount, Item quantity (including voids), Gross amount (including voids), Void quantity, and Voided Gross item amount.
The report displays both time periods in adjacent columns for easier trend analysis.
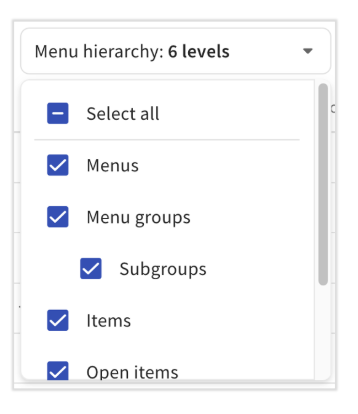
Menu hierarchy and levels
The Menu hierarchy drop-down (also called the level selector) at the top of the report table controls what levels of data appear.
- Select a single level (e.g., Items) to generate a flat list.
- Select multiple levels (e.g., Menus, Menu groups, and Items) to generate a nested, collapsible view.
To expand or collapse the entire table at once, select the arrow (>) icon on the first column of the table header.
Tip: To see your top-selling items, select only Items from the menu hierarchy drop-down, then select the Qty sold or Net item amount column header to sort from highest to lowest.
Percentage of total
Enable the % of total toggle in the upper-right corner of the report table to see each row's contribution as a percentage of its parent level. How the calculation works depends on which levels you have selected:
- If you select Menus, Menu groups/Subgroups, and Items: each item's percentage reflects its share of the parent menu group's sales.
- If you select only Items: each item's percentage reflects its share of all item sales across all menus.
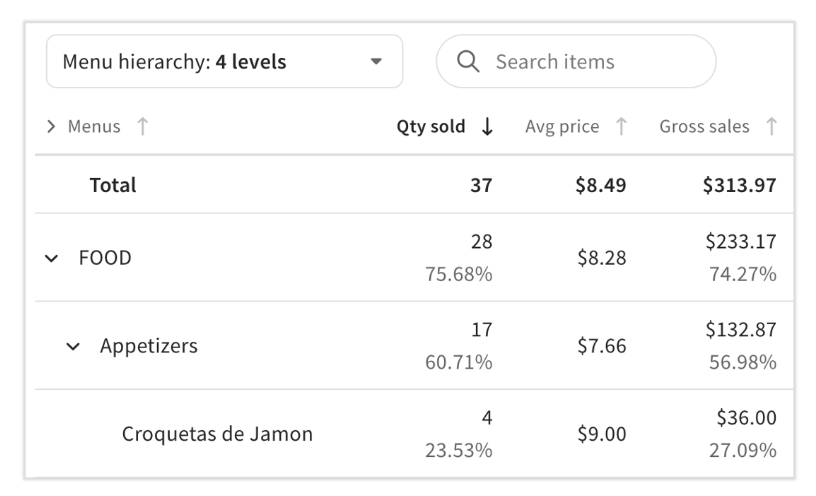
Example with four levels selected (Menus, Menu groups, Subgroups, and Items):
- FOOD accounts for 75.68% of total sales.
- Appetizers make up 60.71% of FOOD sales.
- Croquetas de Jamon make up 23.53% of Appetizers sales.
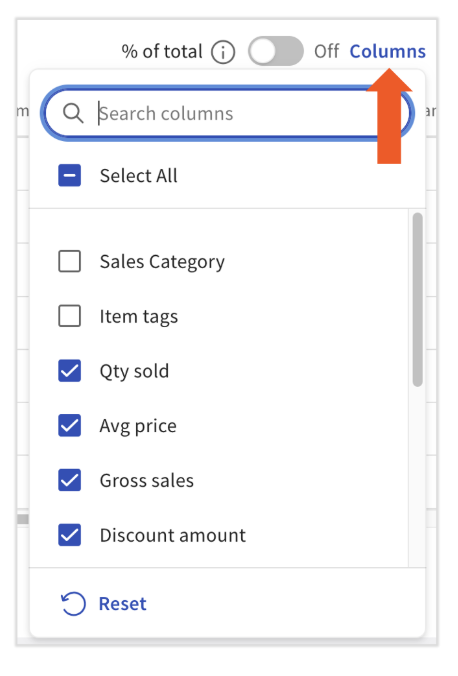
Columns and COGS data
Select the Columns button to customize which data columns appear. Options include sales category, average price, discounts, waste count, void amount, and more.
If you have added cost information to your menu items — through Menu builder or by building recipes in xtraCHEF — you can also display:
- COGS (cost of goods sold)
- Gross profit
- Gross margin
To add item cost without xtraCHEF, navigate to Menus > Menu management > Menu manager, select the item, and enter a value in the Cost field in the Reporting section.
Note: xtraCHEF recipe cost data syncs to Toast Web automatically once daily.
Select the Export button (download icon) to download the full report as an Excel file or .csv. You may need to scroll left and right to see all columns before exporting.
Report settings
Select the gear icon at the top right of the report to open Report settings.
Calculation settings (select one):
- Calculate item prices including modifiers (default): Combines modifier pricing with item pricing to calculate average price.
- Calculate item prices without modifiers: Excludes modifier pricing from the item's average price. Modifier prices appear as separate rows.
Optional:
- Aggregate data by name: Combines items that share the same name — for example, "Cheeseburger" — even if they have different IDs across menus or POS canvases. Enable this setting if the same item is appearing as two separate rows on the report.
Data display setting:
- Hide menus, menu groups, and items with no data: Removes rows with no sales in the selected date range. This setting is enabled by default. If items appear to be missing from your report, deselect this checkbox.
Known limitations
The following features are not currently available in the PMIX report:
- Automatic scheduled emails: The PMIX report cannot be emailed on a recurring schedule. See Automatically Send the Product Mix Report by Email for the current status of this feature request.
- Filter by payment type: Items cannot be filtered or grouped by payment type.
- Filter or group by size: Size variants appear as separate modifier rows when modifiers are included, but there is no dedicated size filter.
- Item sales by employee: The PMIX report does not show who sold each item. Use the Top Menu Items report and select your desired employee from the employee drop-down for that view.
- Retroactive sales category updates: Changing a sales category does not update historical PMIX data. Sales categories are applied at the time of sale.
Frequently asked questions
Why do net sales on the PMIX report not match other sales reports?
This is expected. The PMIX report calculates net sales differently from reports like the Sales Summary. Here, you will see them listed as Net item amount.
- Service charges are excluded. Both gratuity and non-gratuity service charges are not included in PMIX net sales.
- Partial and unlinked refunds are excluded. Partial refunds (custom amount) and unlinked refunds (not tied to a specific item) do not appear in PMIX.
- Refund timing differs. PMIX applies refunds to the date of the original sale. The Sales Summary applies them on the date the refund was processed.
- Tips are not included in PMIX.
- PMIX may have a brief data delay. If you're comparing reports right after a transaction, a short delay can cause a temporary mismatch.
Why are some items missing from my PMIX report?
First, check the Data display setting. Select the gear icon in the top right corner, then deselect Hide menus, menu groups, and items with no data. This setting is enabled by default and removes any row with zero sales in the selected date range.
If items are still missing after adjusting this setting, try widening your date range or waiting for the data delay to resolve.
Does the PMIX report include returns and refunds?
Yes. The PMIX report applies refunds to the date of the original sale, not the date the refund was processed. This provides a more accurate view of net performance for that day. Note that partial refunds and unlinked refunds are excluded. See "Why do net sales on the PMIX report not match other sales reports?" above for full details.
Why does the same item appear twice on the PMIX report?
This typically happens when the same item exists in multiple menus with different item IDs. To fix this, select the gear icon > Report settings and enable Aggregate data by name. This combines items that share the same name across menus and canvases into a single row.
How do I see the whole table?
Select the arrow (>) icon on the first column of the table header to expand or collapse the entire table at once.
Can I display items by payment type on the PMIX report?
No. The PMIX report cannot be configured to display items by payment type.
How do I view top items, top menus, or top modifiers?
Select only Items (or Menus, or Modifiers) from the Menu hierarchy drop-down, then select the Qty sold, Net item amount, or Gross item amount column header to sort from highest to lowest. You can also use the Top Menu Items report under Reports > Menus for a dedicated top-items view.
How do I compare PMIX by day of the week?
Day-of-week filtering is not currently available directly within the PMIX report. To analyze by day of the week, use the Export button to download the report as a .csv or Excel file, then analyze by date column in your preferred spreadsheet tool.
Can I have the PMIX report emailed to me automatically?
Not currently. Neither Toast nor xtraCHEF can automatically send a PMIX report on a recurring schedule. The team has noted this as a feature request. See Automatically Send the Product Mix Report by Email for the full answer and any updates.
What permission is needed to access the PMIX report?
Users need the 4.2 Menu Reports permission. For instructions on assigning permissions to a user, see Access Permissions Reference.
Related articles
- Menu Reports Overview
- Automatically Send the Product Mix Report by Email
- Access Permissions Reference
- xtraCHEF: Variance Analysis and Product Mix Reports