Sling by Toast: Reports
Last updated: Jun 11, 2026, 1:22 PM
Learn about the report options on Sling
- Understand Reports
- Labor Report
- Payroll Report
- Attendance Report
- Shift Feedback Report
- Time Off Report
- Sales Report
- Customize Reports
- Add Sales Data
- Export Payroll
- Compare Payroll and Timesheets
Understand Reports
Reports are part of the Business subscription and allow you to view or export data related to labor cost functions, attendance, time off, and shift feedback. Reports can be run by day, week, month, or custom date range. Most report data can also be sorted by employee, position, location, or group.
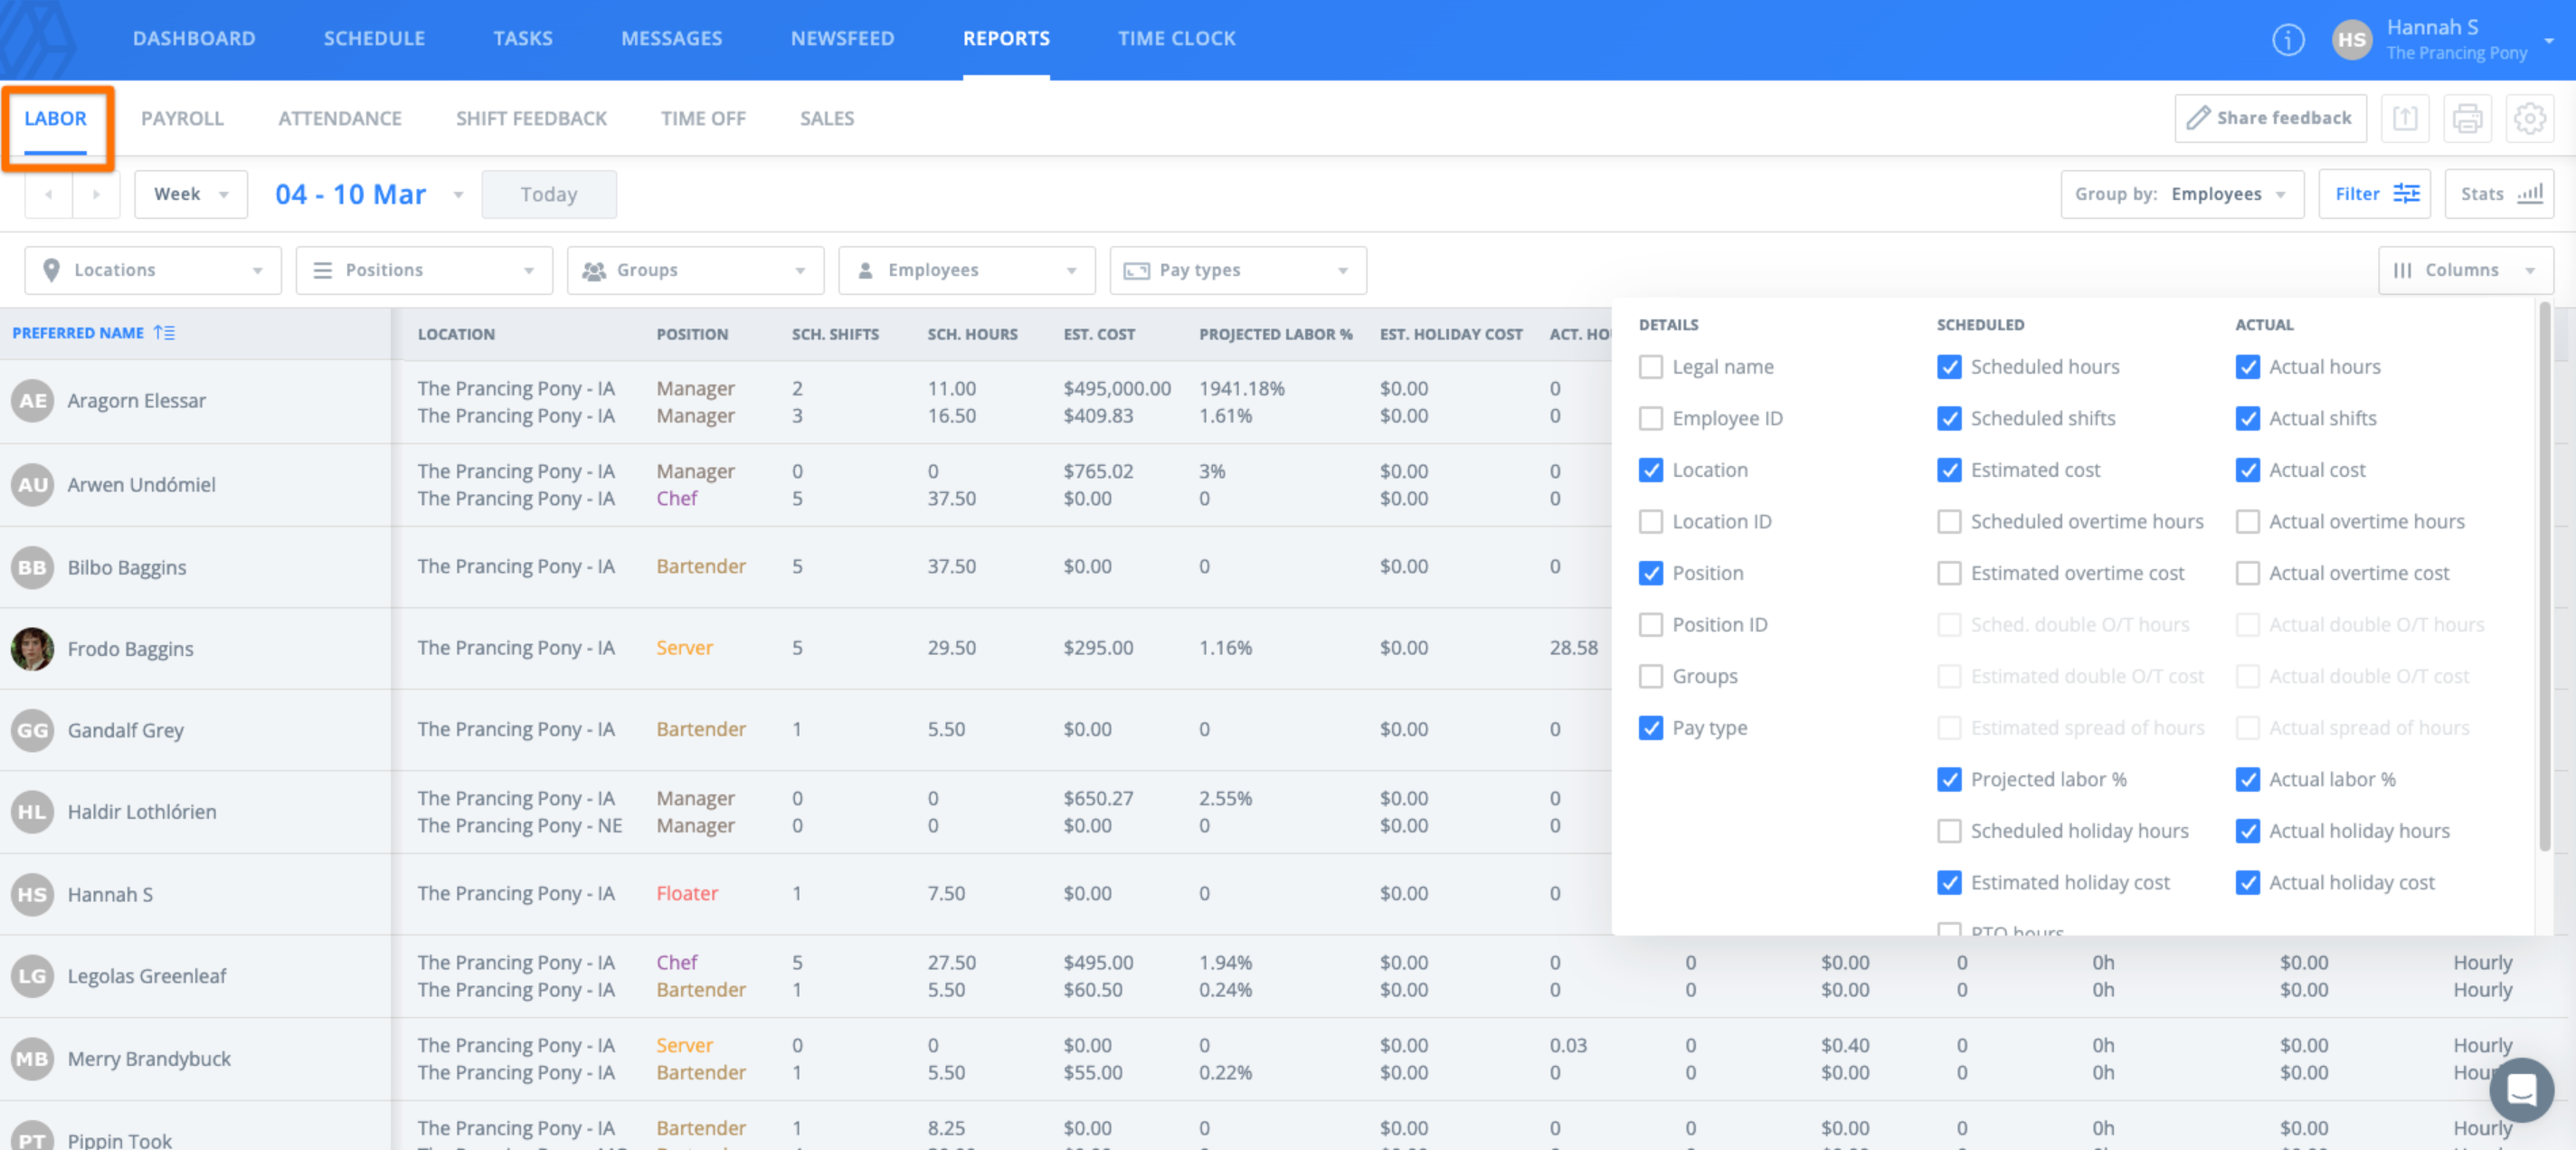
Labor Report
Labor reports return data based on scheduled hours or actual hours, so you can estimate, review, or compare projected labor spend against actual labor spend for the selected range. This report is also helpful if you want to use scheduled data to process payroll, since it is the only report that returns hours and wages based on scheduled shifts rather than time clock activity.
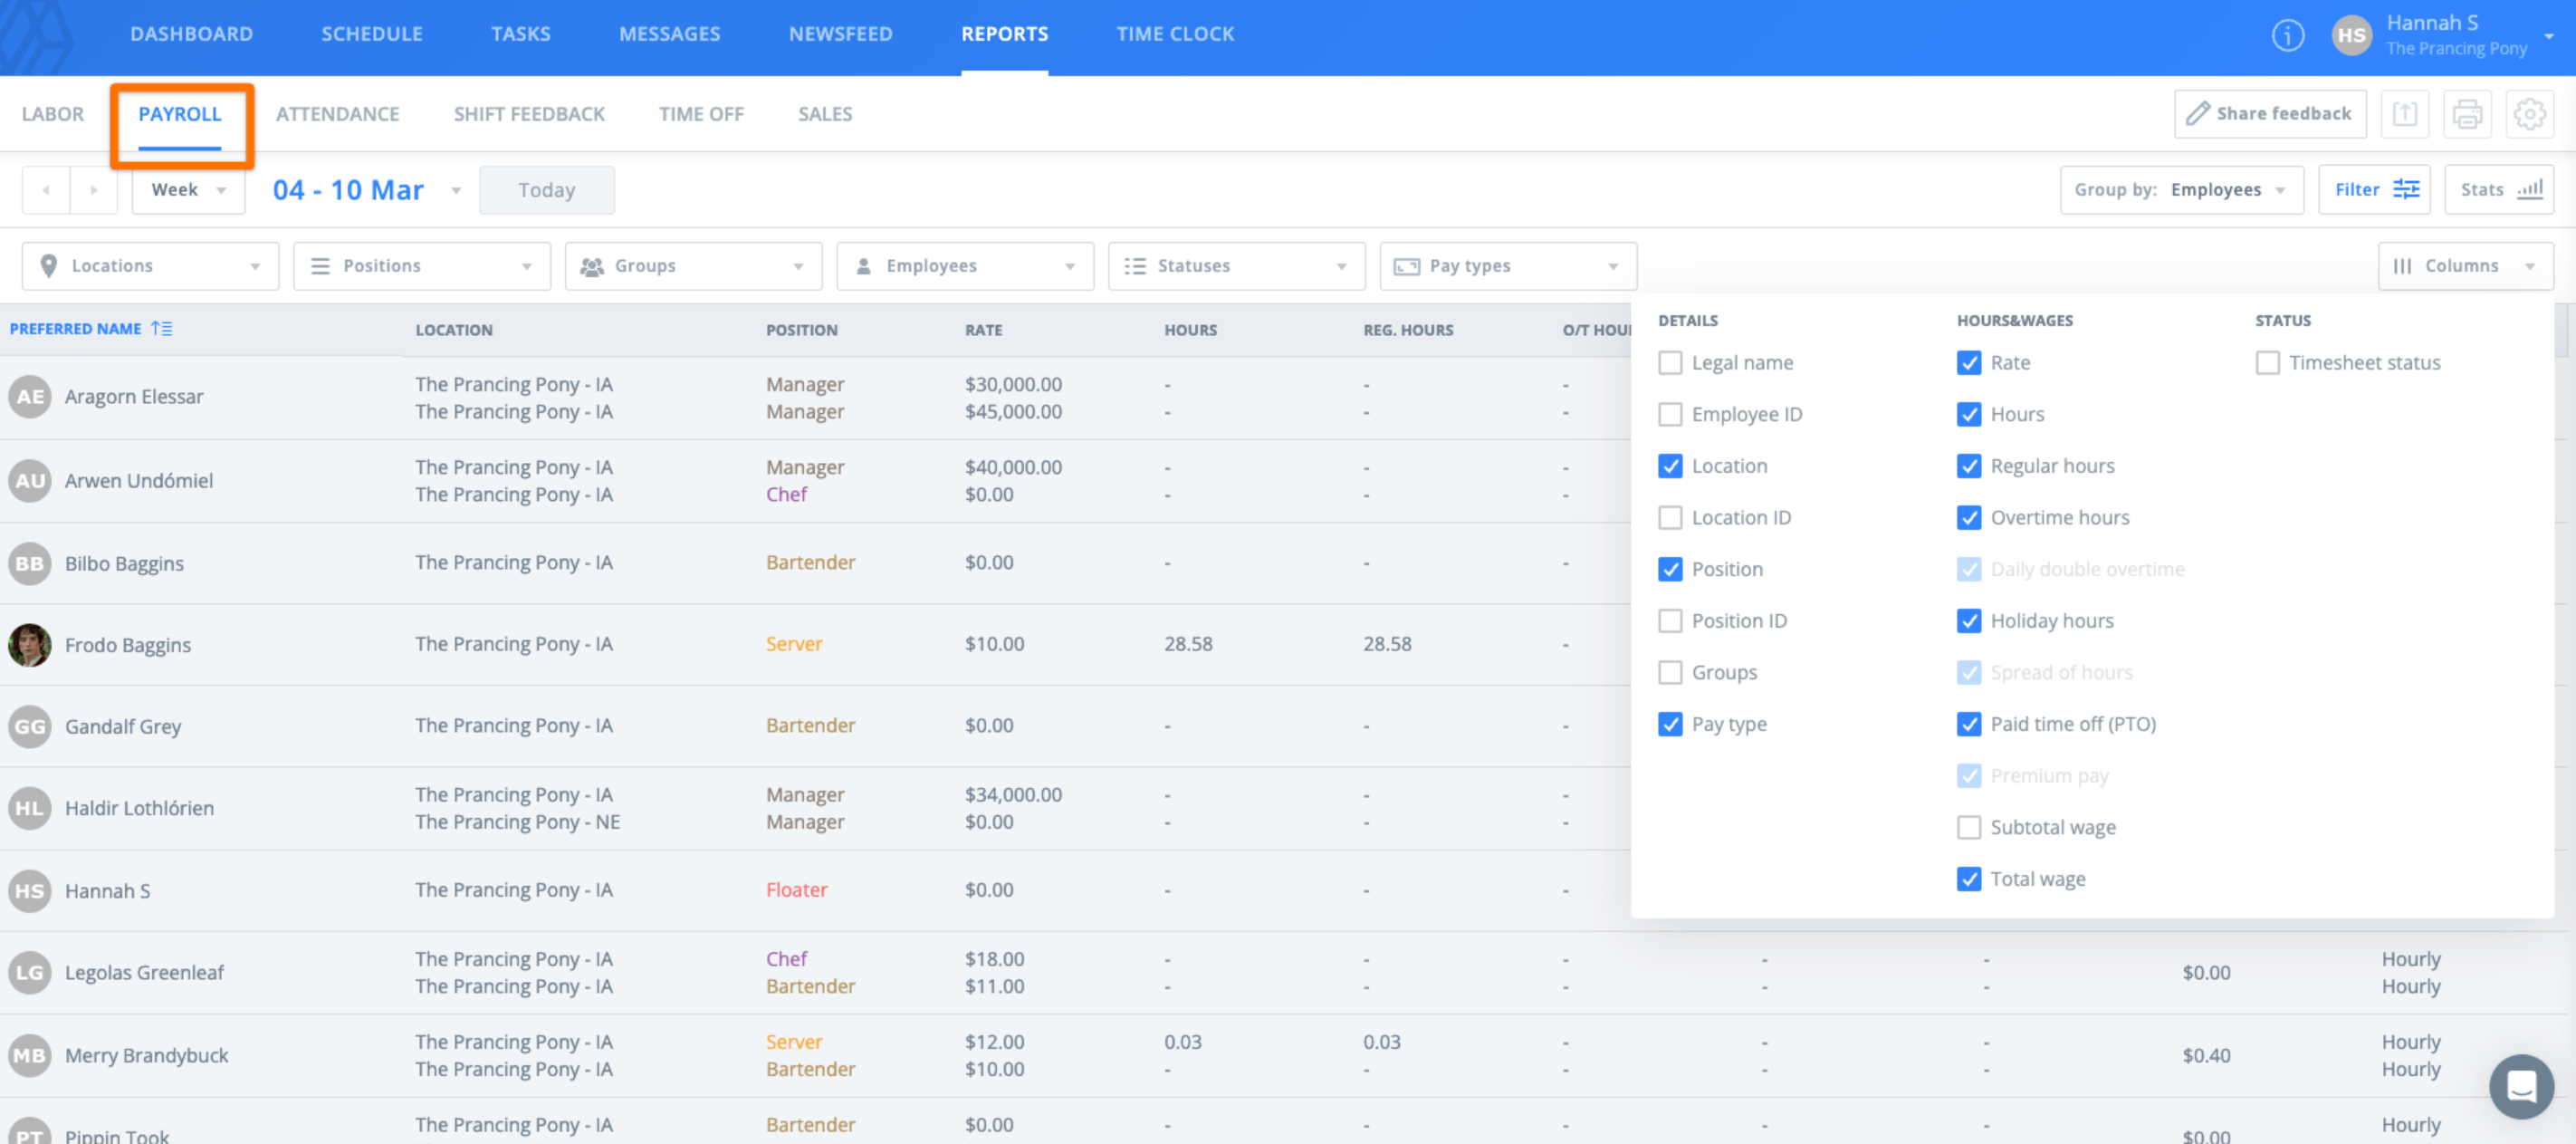
Payroll Report
Payroll reports are based on time clock activity and reflect actual time worked by an employee. You can export Payroll reports so you can upload the data to your payroll processing service or software.
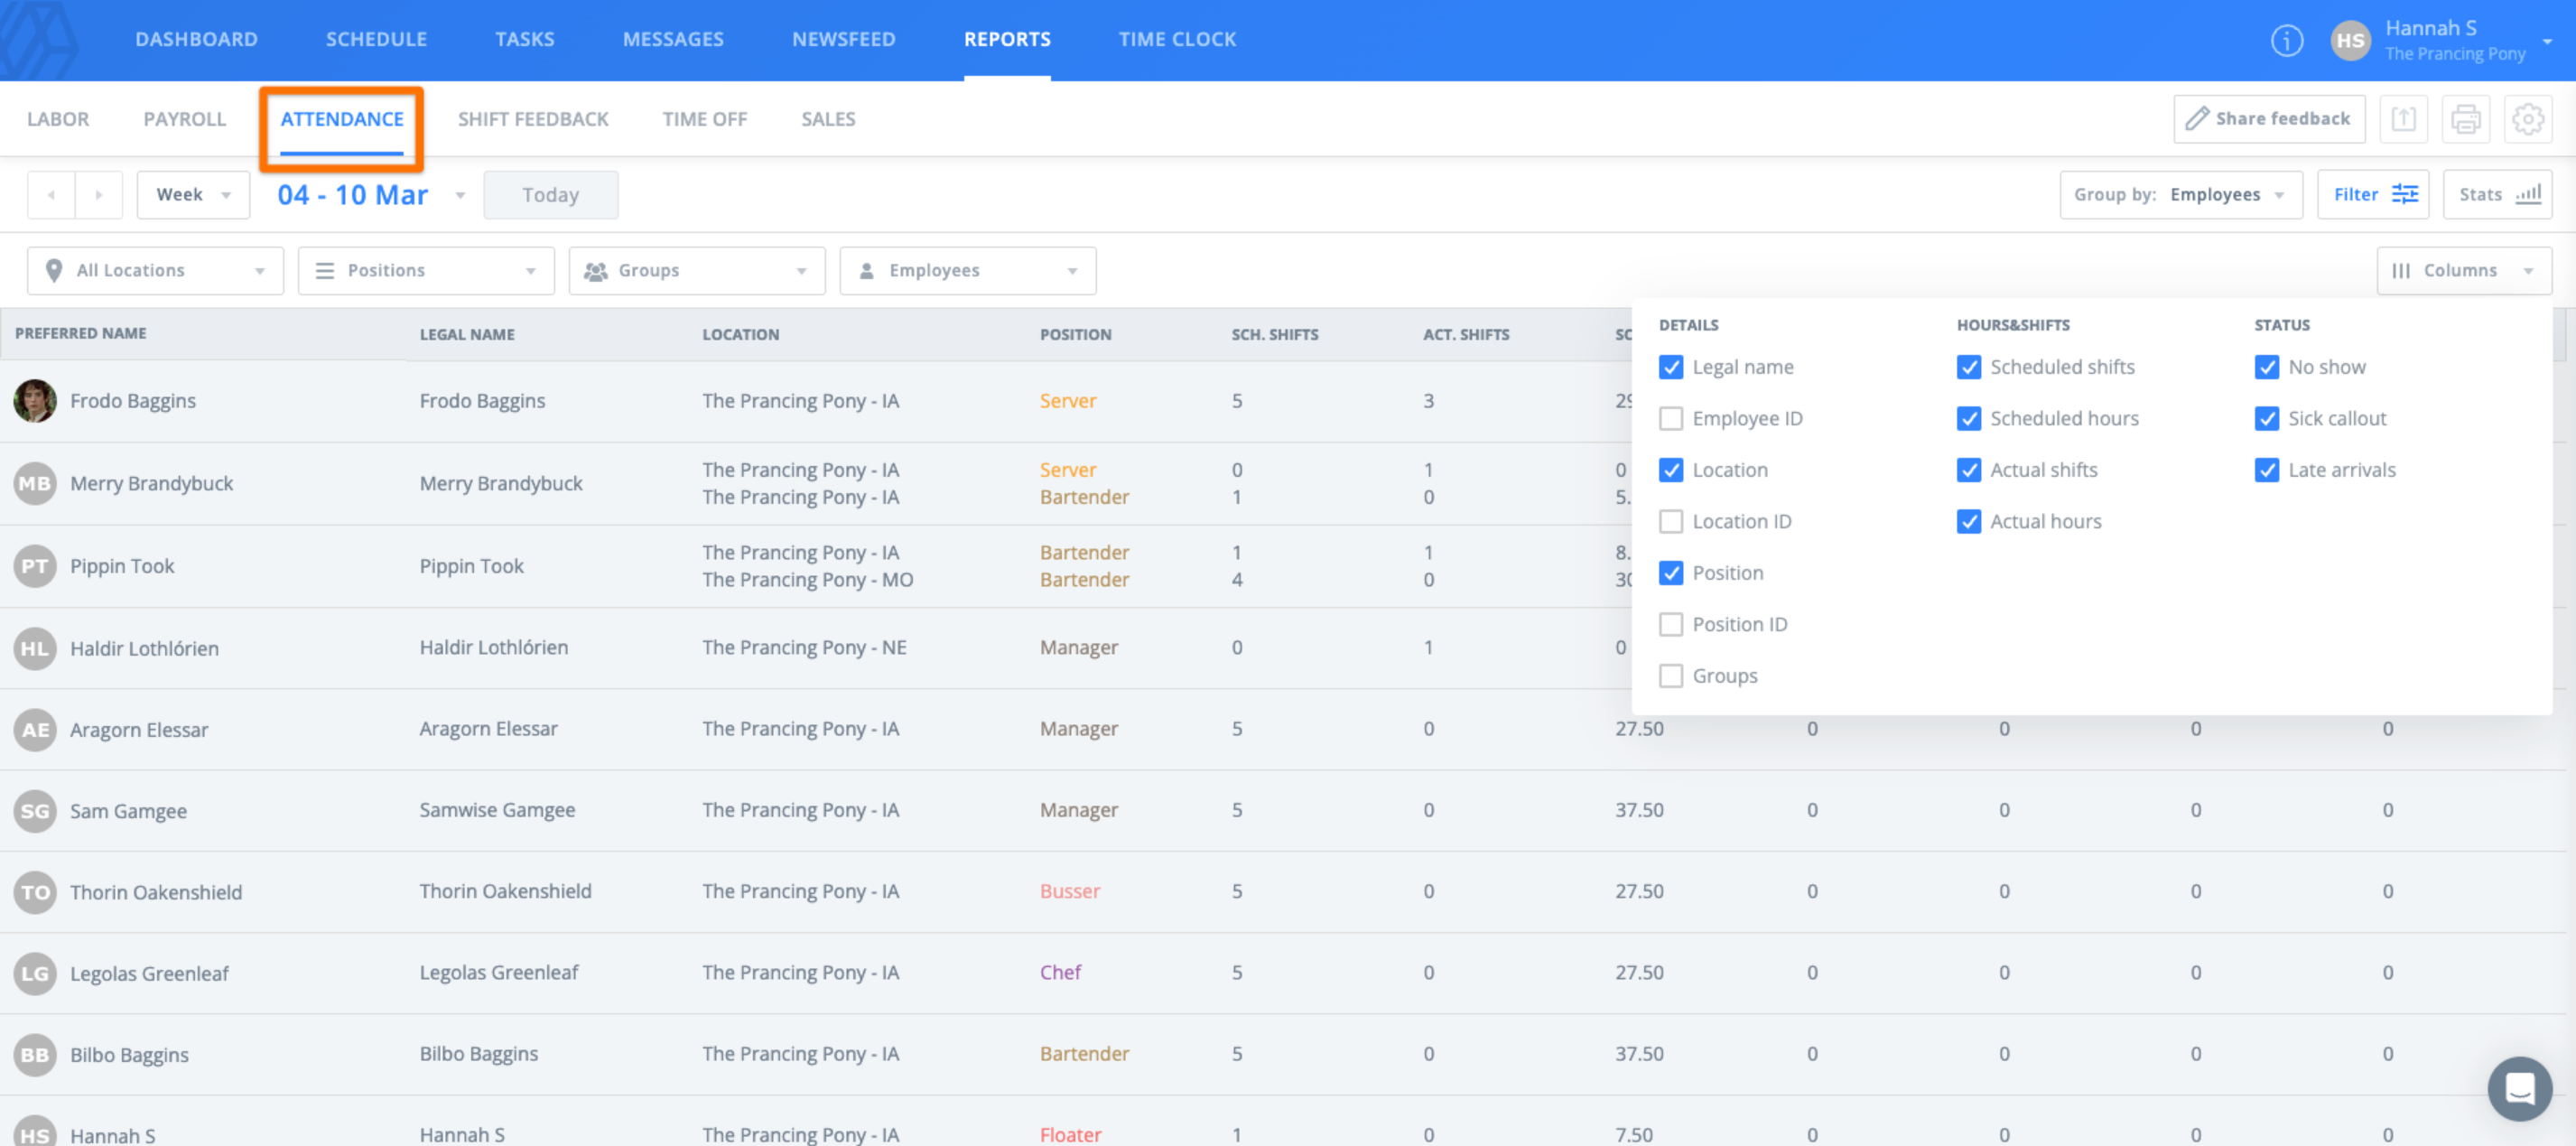
Attendance Report
Attendance reports allow you to compare scheduled shifts versus shifts worked so you can see how often employees are missing work.
Actual shifts are counted based on time clock activity. No-shows and sick call-outs are counted based on how many times an admin or manager marked an employee's shift that way. Late arrivals are also tracked here based on your settings and time clock activity.
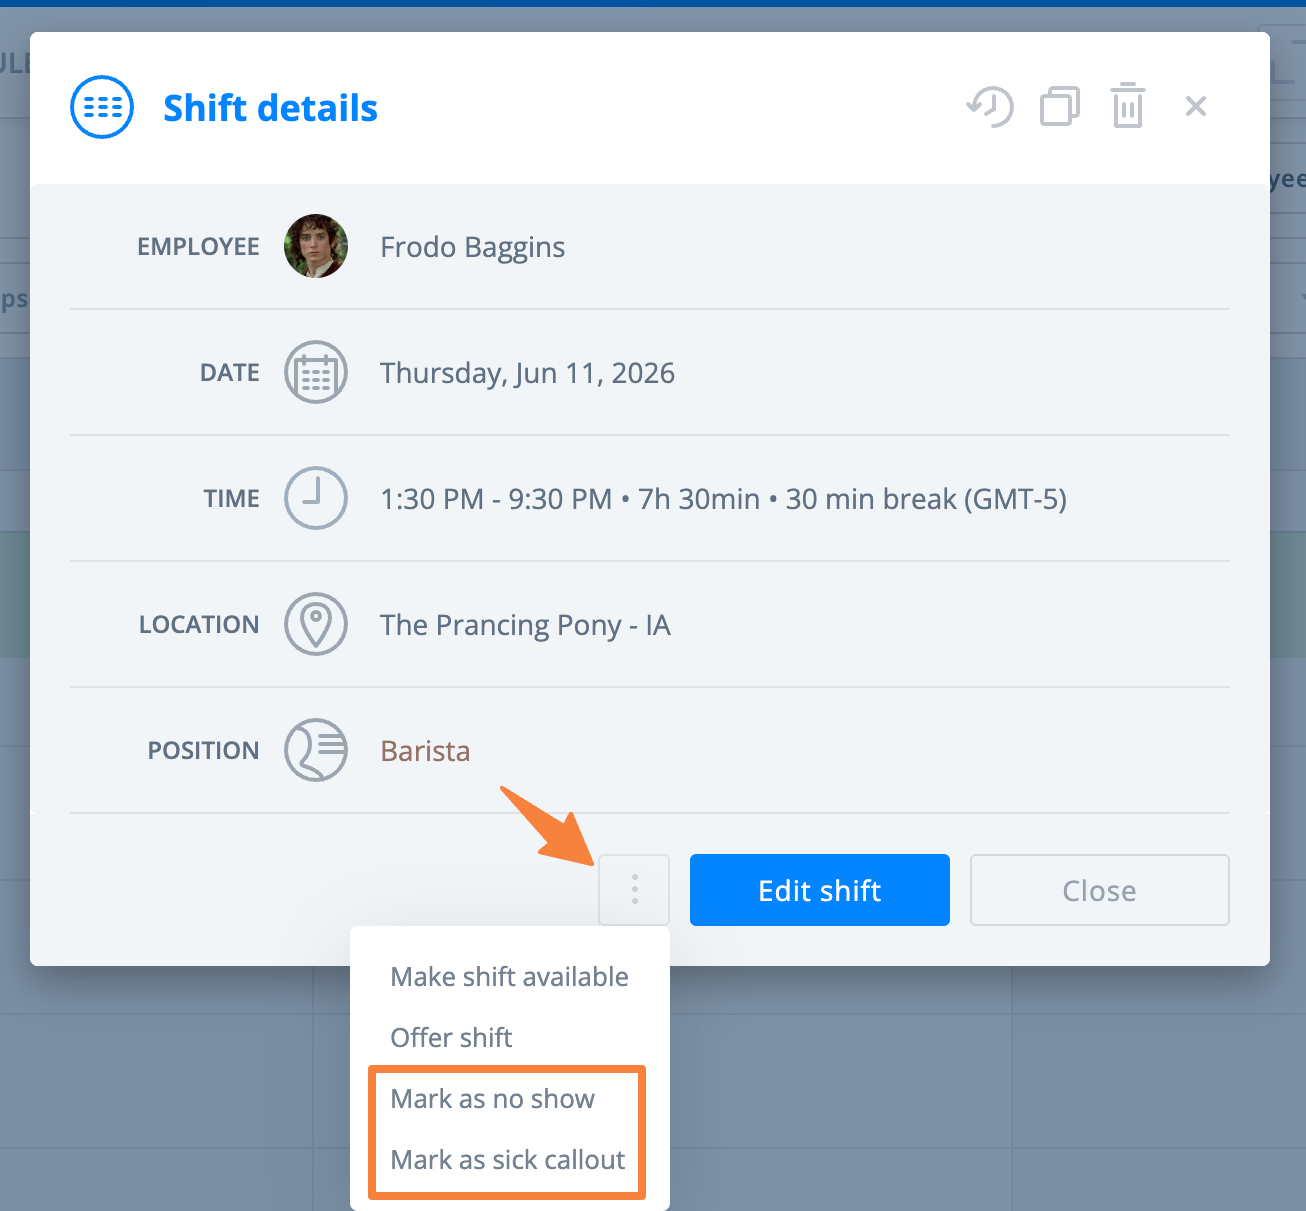
Mark a Shift as a No Show or Sick Callout
You can mark a shift as a no-show or sick callout from both the web and the mobile app.
From the web:
- Navigate to the Schedule page and select a shift.
- Select the 3-dot option, then select Mark as no show or Mark as sick callout.
- If you have enabled PTO tracking and the Sick category, the callout will also be counted as paid, but you can choose to mark it as unpaid. If the shift is longer than the maximum paid hours for a full day set in Settings > Time Off, the employee will only be paid for the number of hours set as the maximum and not the number of hours their shift was scheduled for.
- If you have enabled PTO tracking and the Sick category, the callout will also be counted as paid, but you can choose to mark it as unpaid. If the shift is longer than the maximum paid hours for a full day set in Settings > Time Off, the employee will only be paid for the number of hours set as the maximum and not the number of hours their shift was scheduled for.
- You can add a comment, such as the reason, and decide whether to leave the shift uncovered, assign it to someone else, unassign it, make it available, or offer it.
- Select Save.
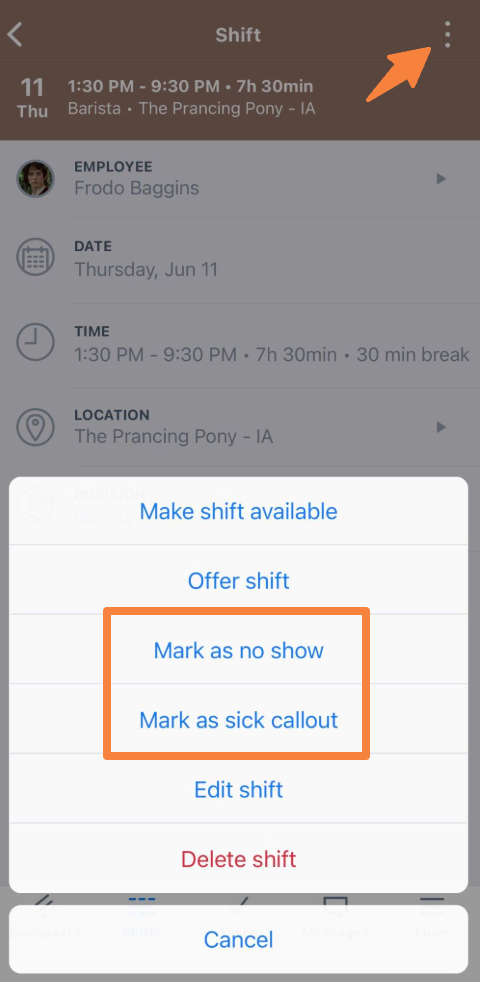
From the mobile app:
- Navigate to the Shifts tab and select a shift.
- Select the 3-dot option in the upper right corner, then select Mark as no show or Mark as sick callout.
- If you have enabled PTO tracking and the Sick category, the callout will also be counted as paid, but you can choose to mark it as unpaid. If the shift is longer than the maximum paid hours for a full day set in Settings > Time Off, the employee will only be paid for the number of hours set as the maximum and not the number of hours their shift was scheduled for.
- If you have enabled PTO tracking and the Sick category, the callout will also be counted as paid, but you can choose to mark it as unpaid. If the shift is longer than the maximum paid hours for a full day set in Settings > Time Off, the employee will only be paid for the number of hours set as the maximum and not the number of hours their shift was scheduled for.
- You can add a comment, such as the reason, and decide whether to leave the shift uncovered, assign it to someone else, unassign it, make it available, or offer it.
- Select Save.
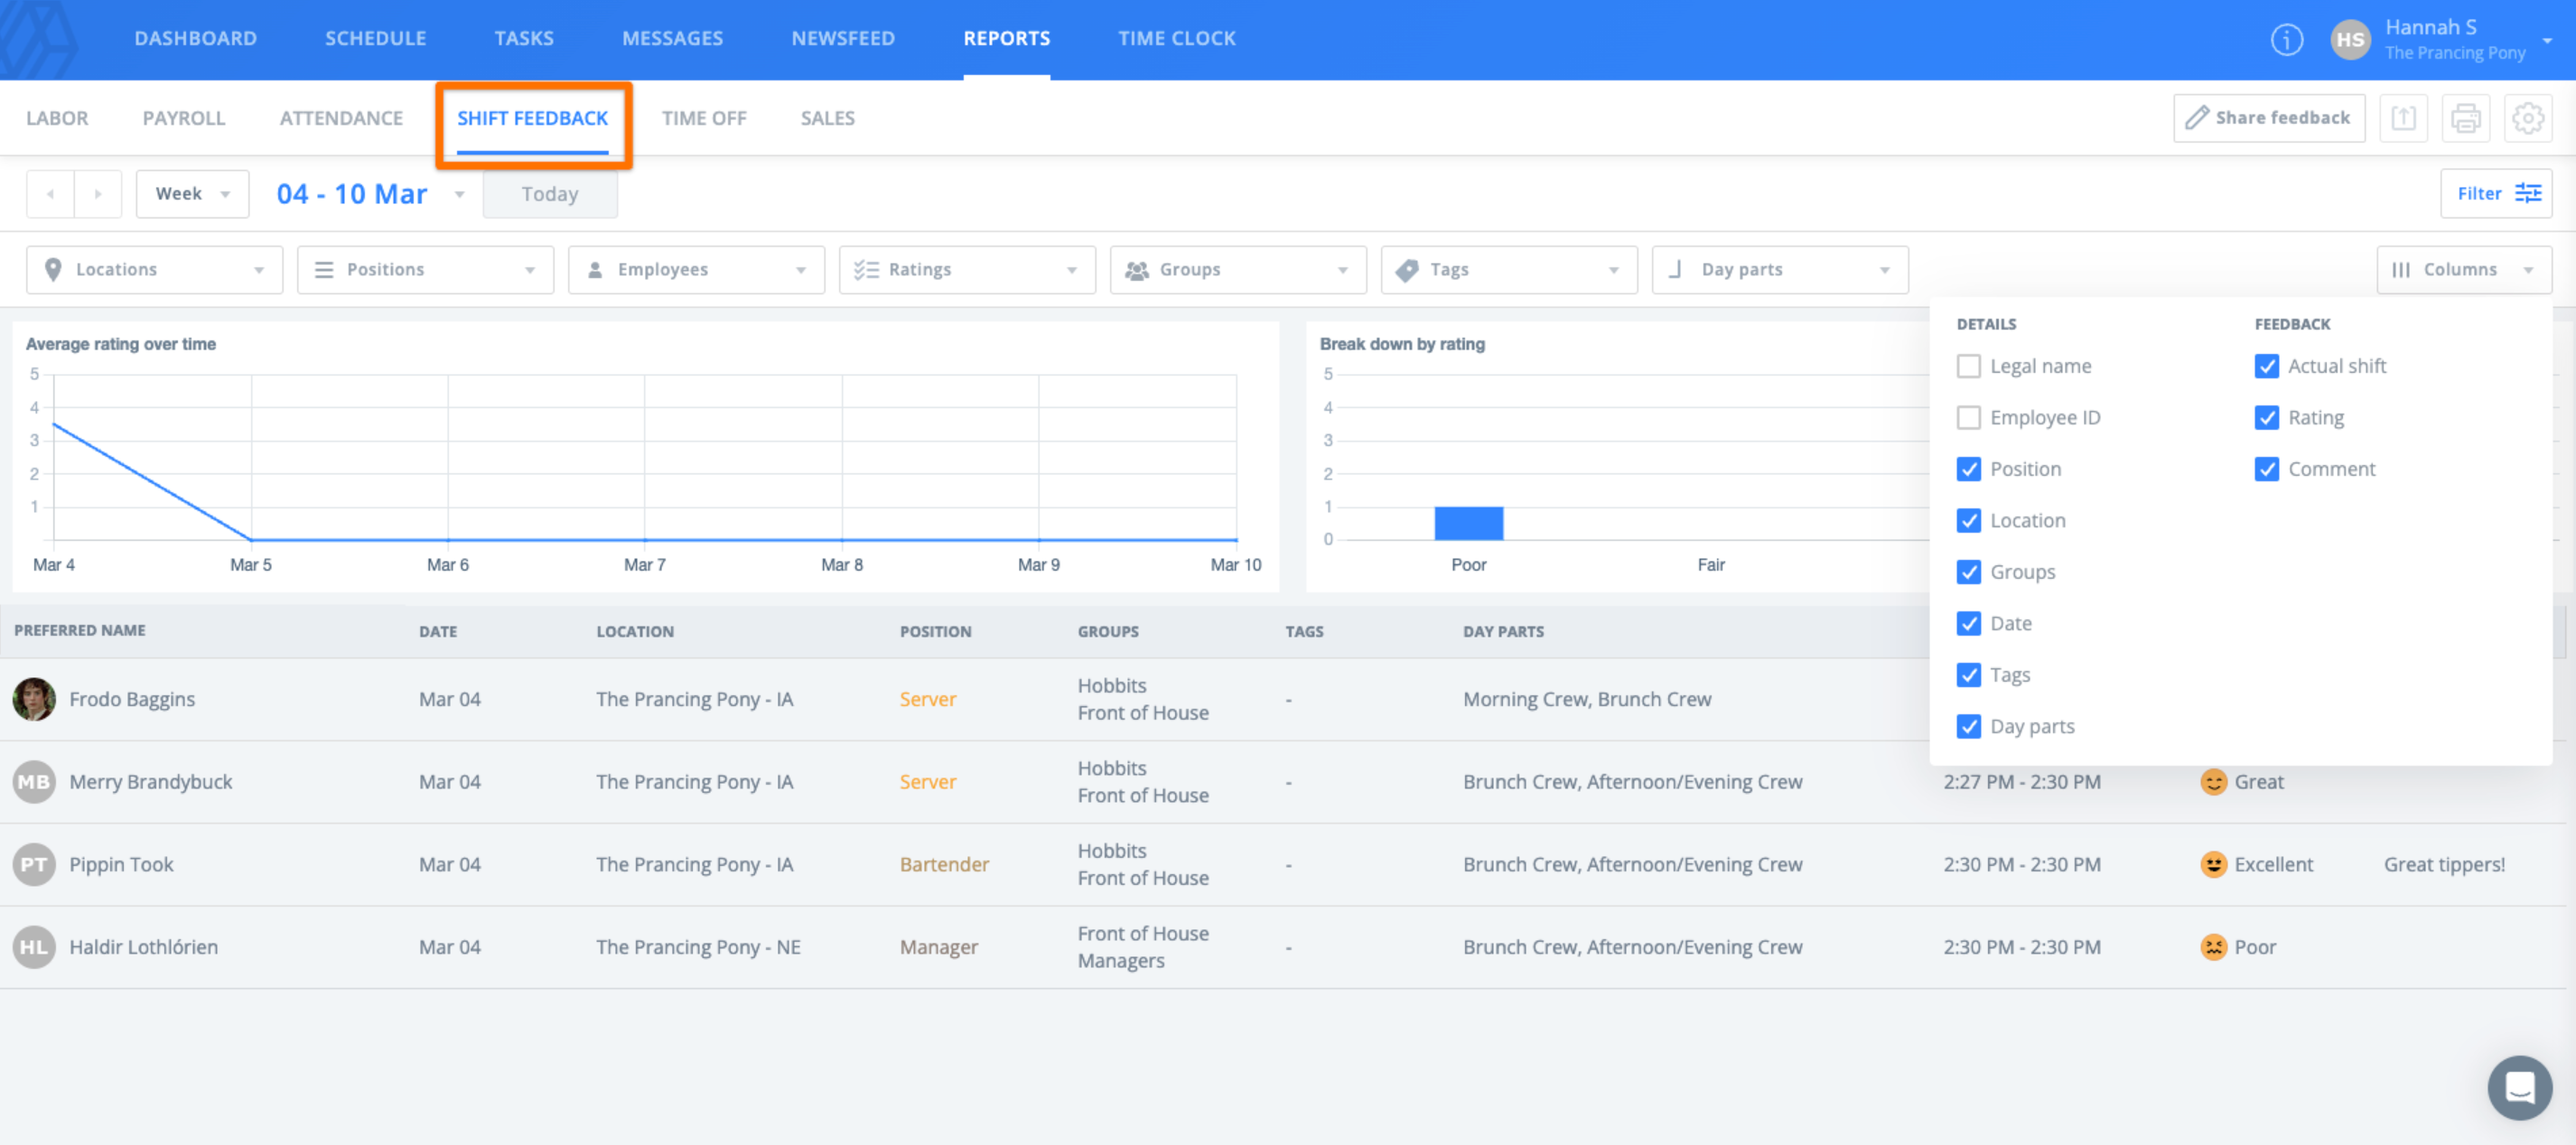
Shift Feedback Report
Shift Feedback reports allow you to view and track employee engagement and happiness. The graph on the left shows the average rating over time for the selected time frame. The graph on the right shows the breakdown by rating for the selected time frame.
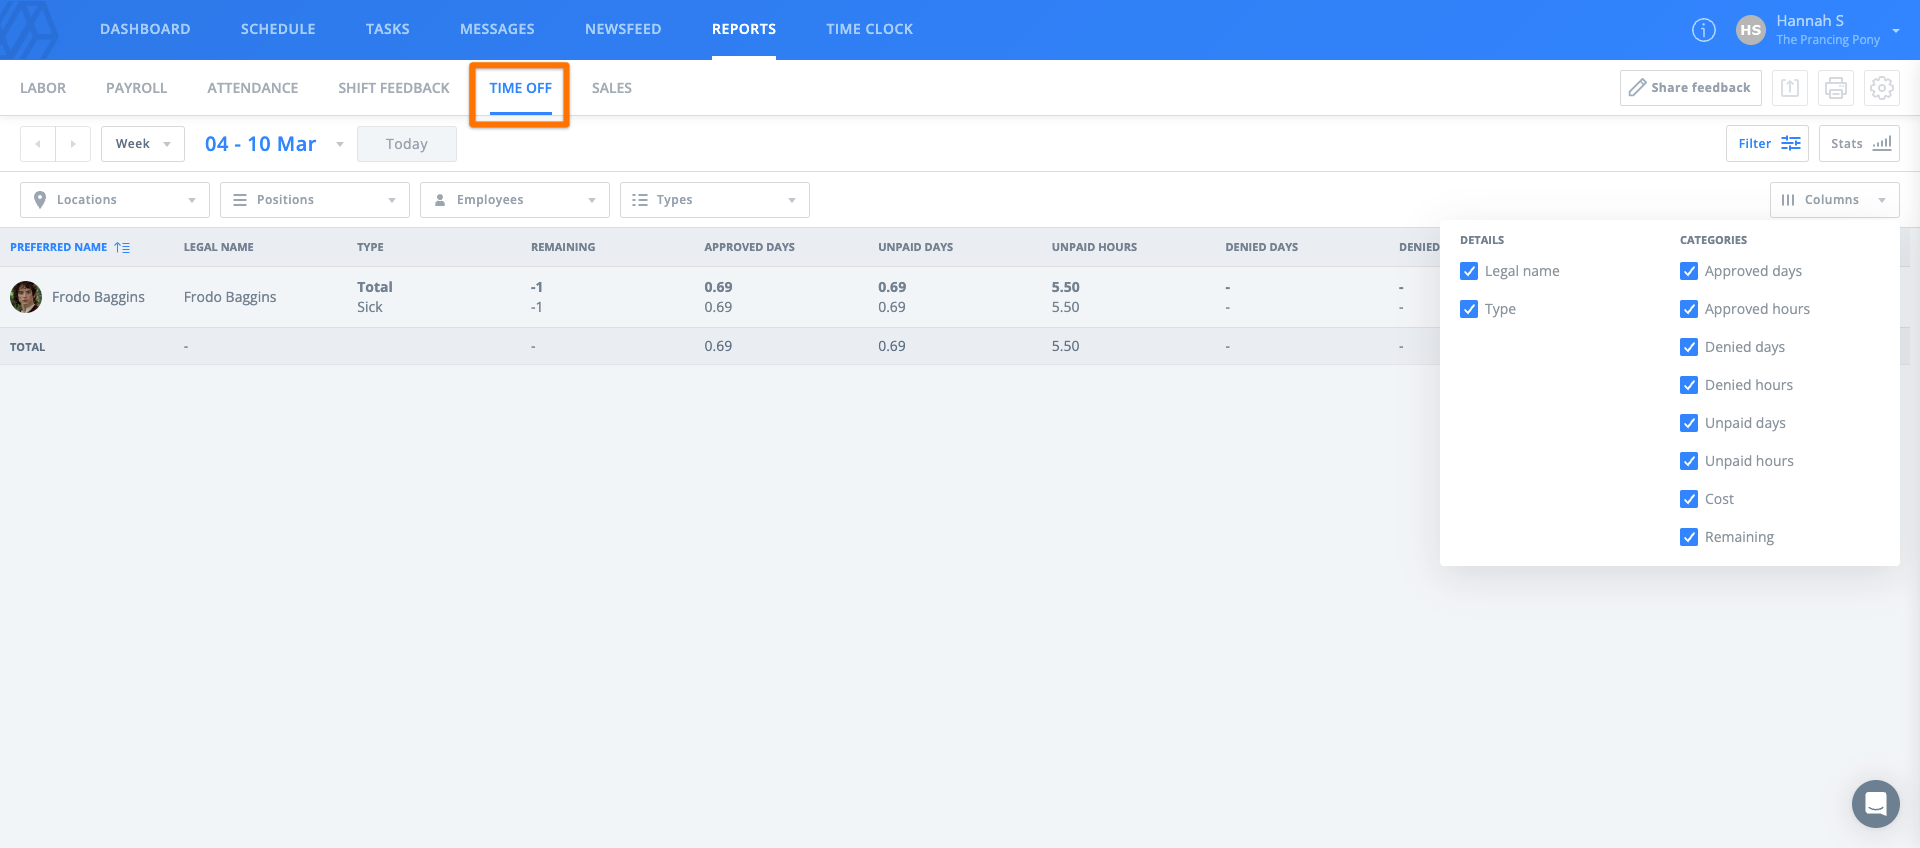
Time Off Report
Time Off reports show approved time off for the selected range, along with the request type and whether the time off is paid or unpaid.
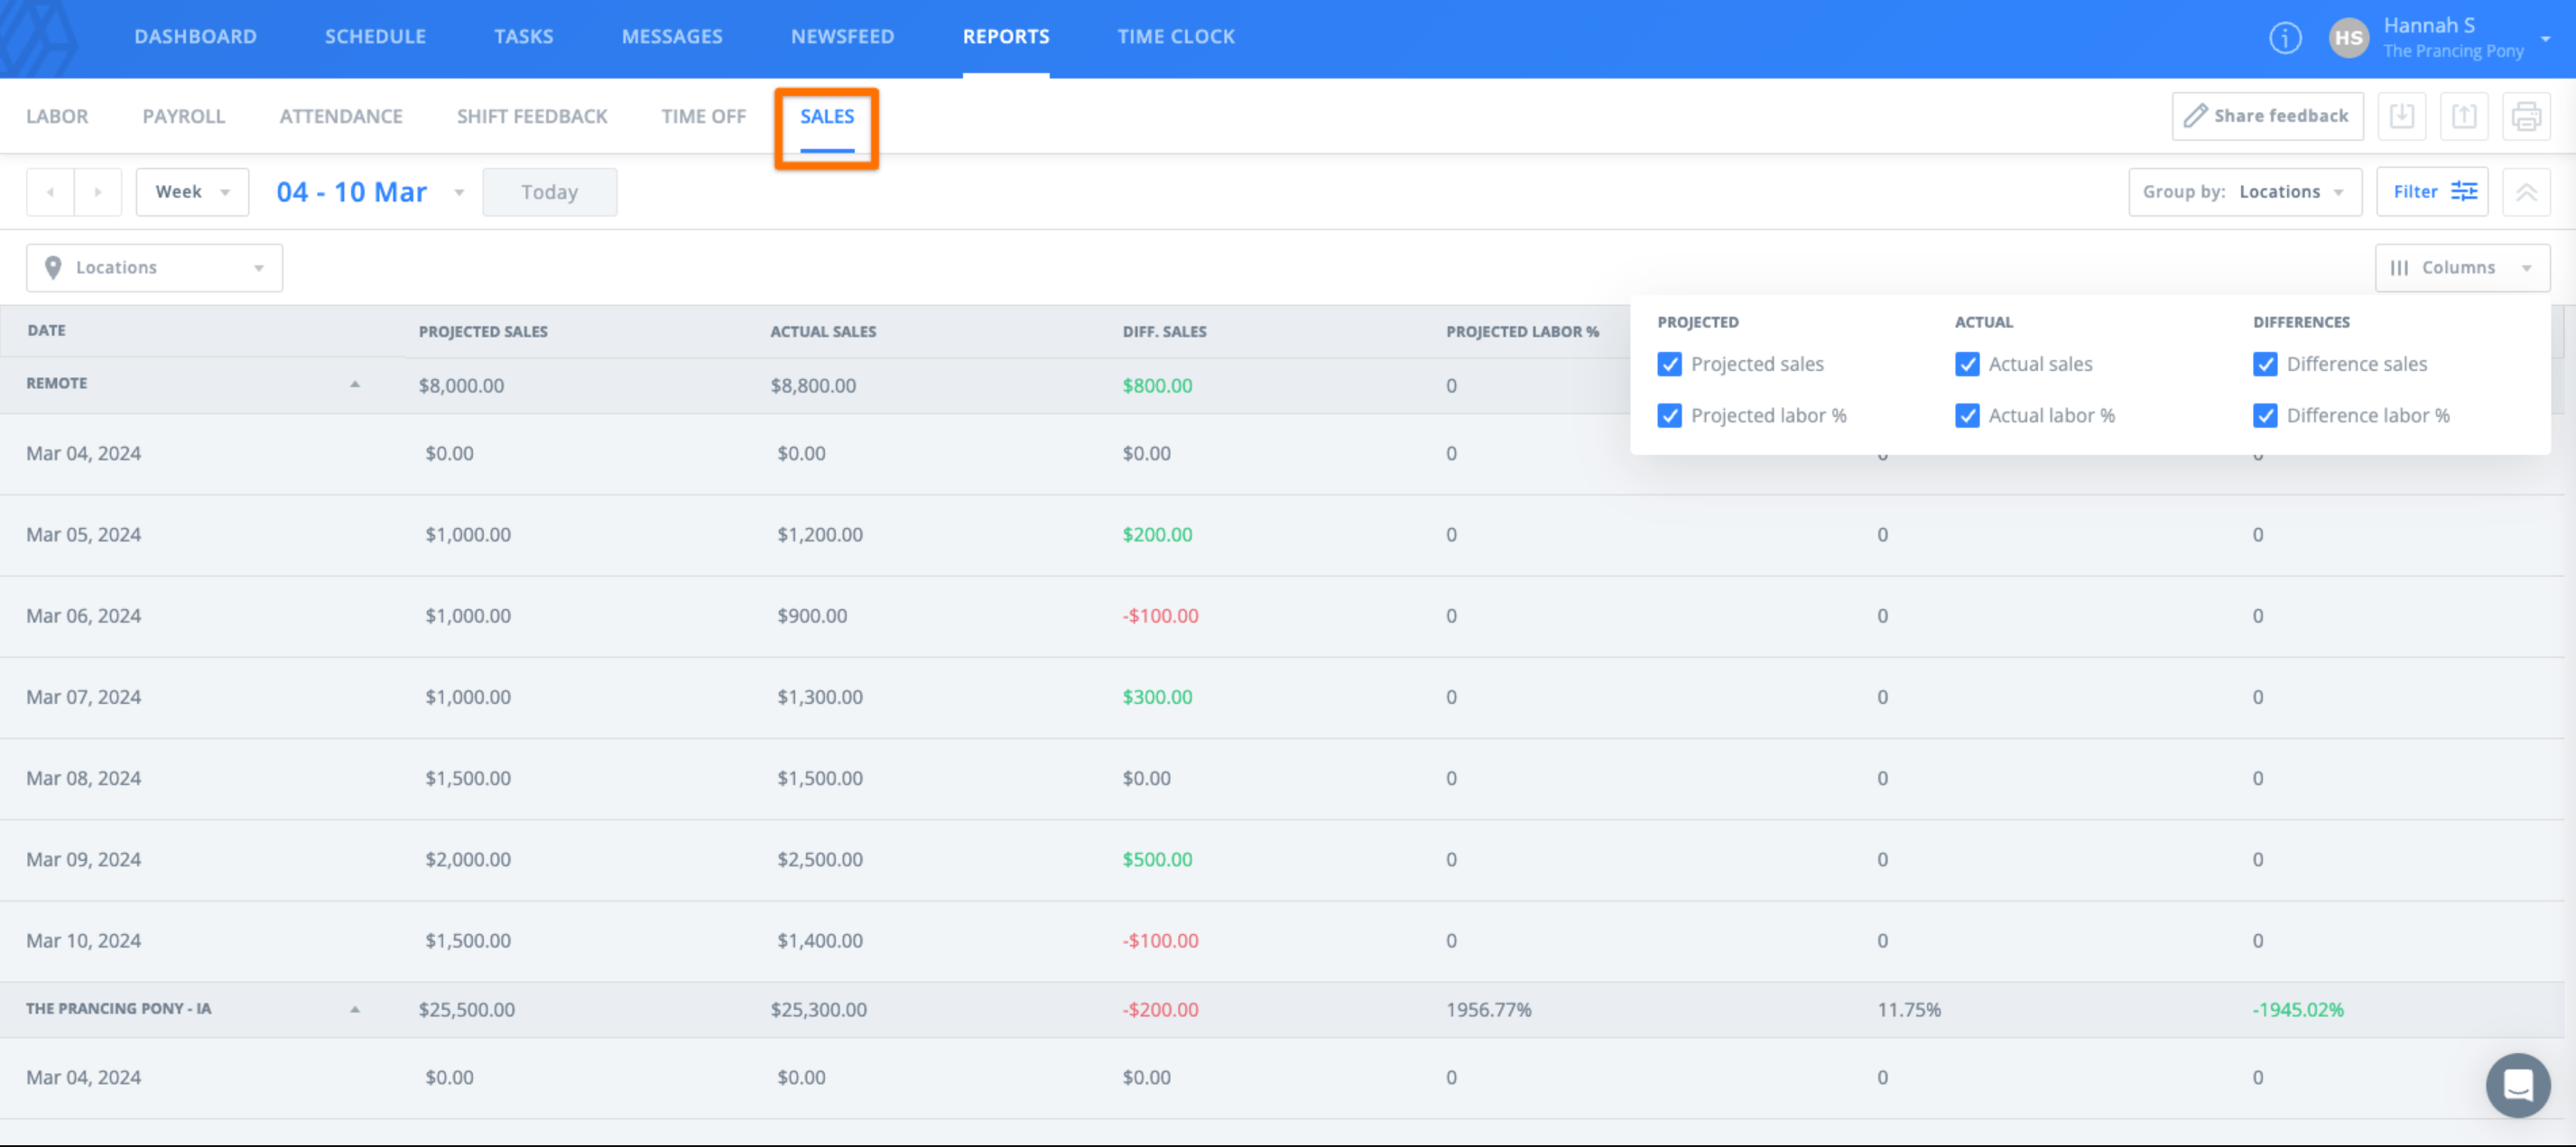
Sales Report
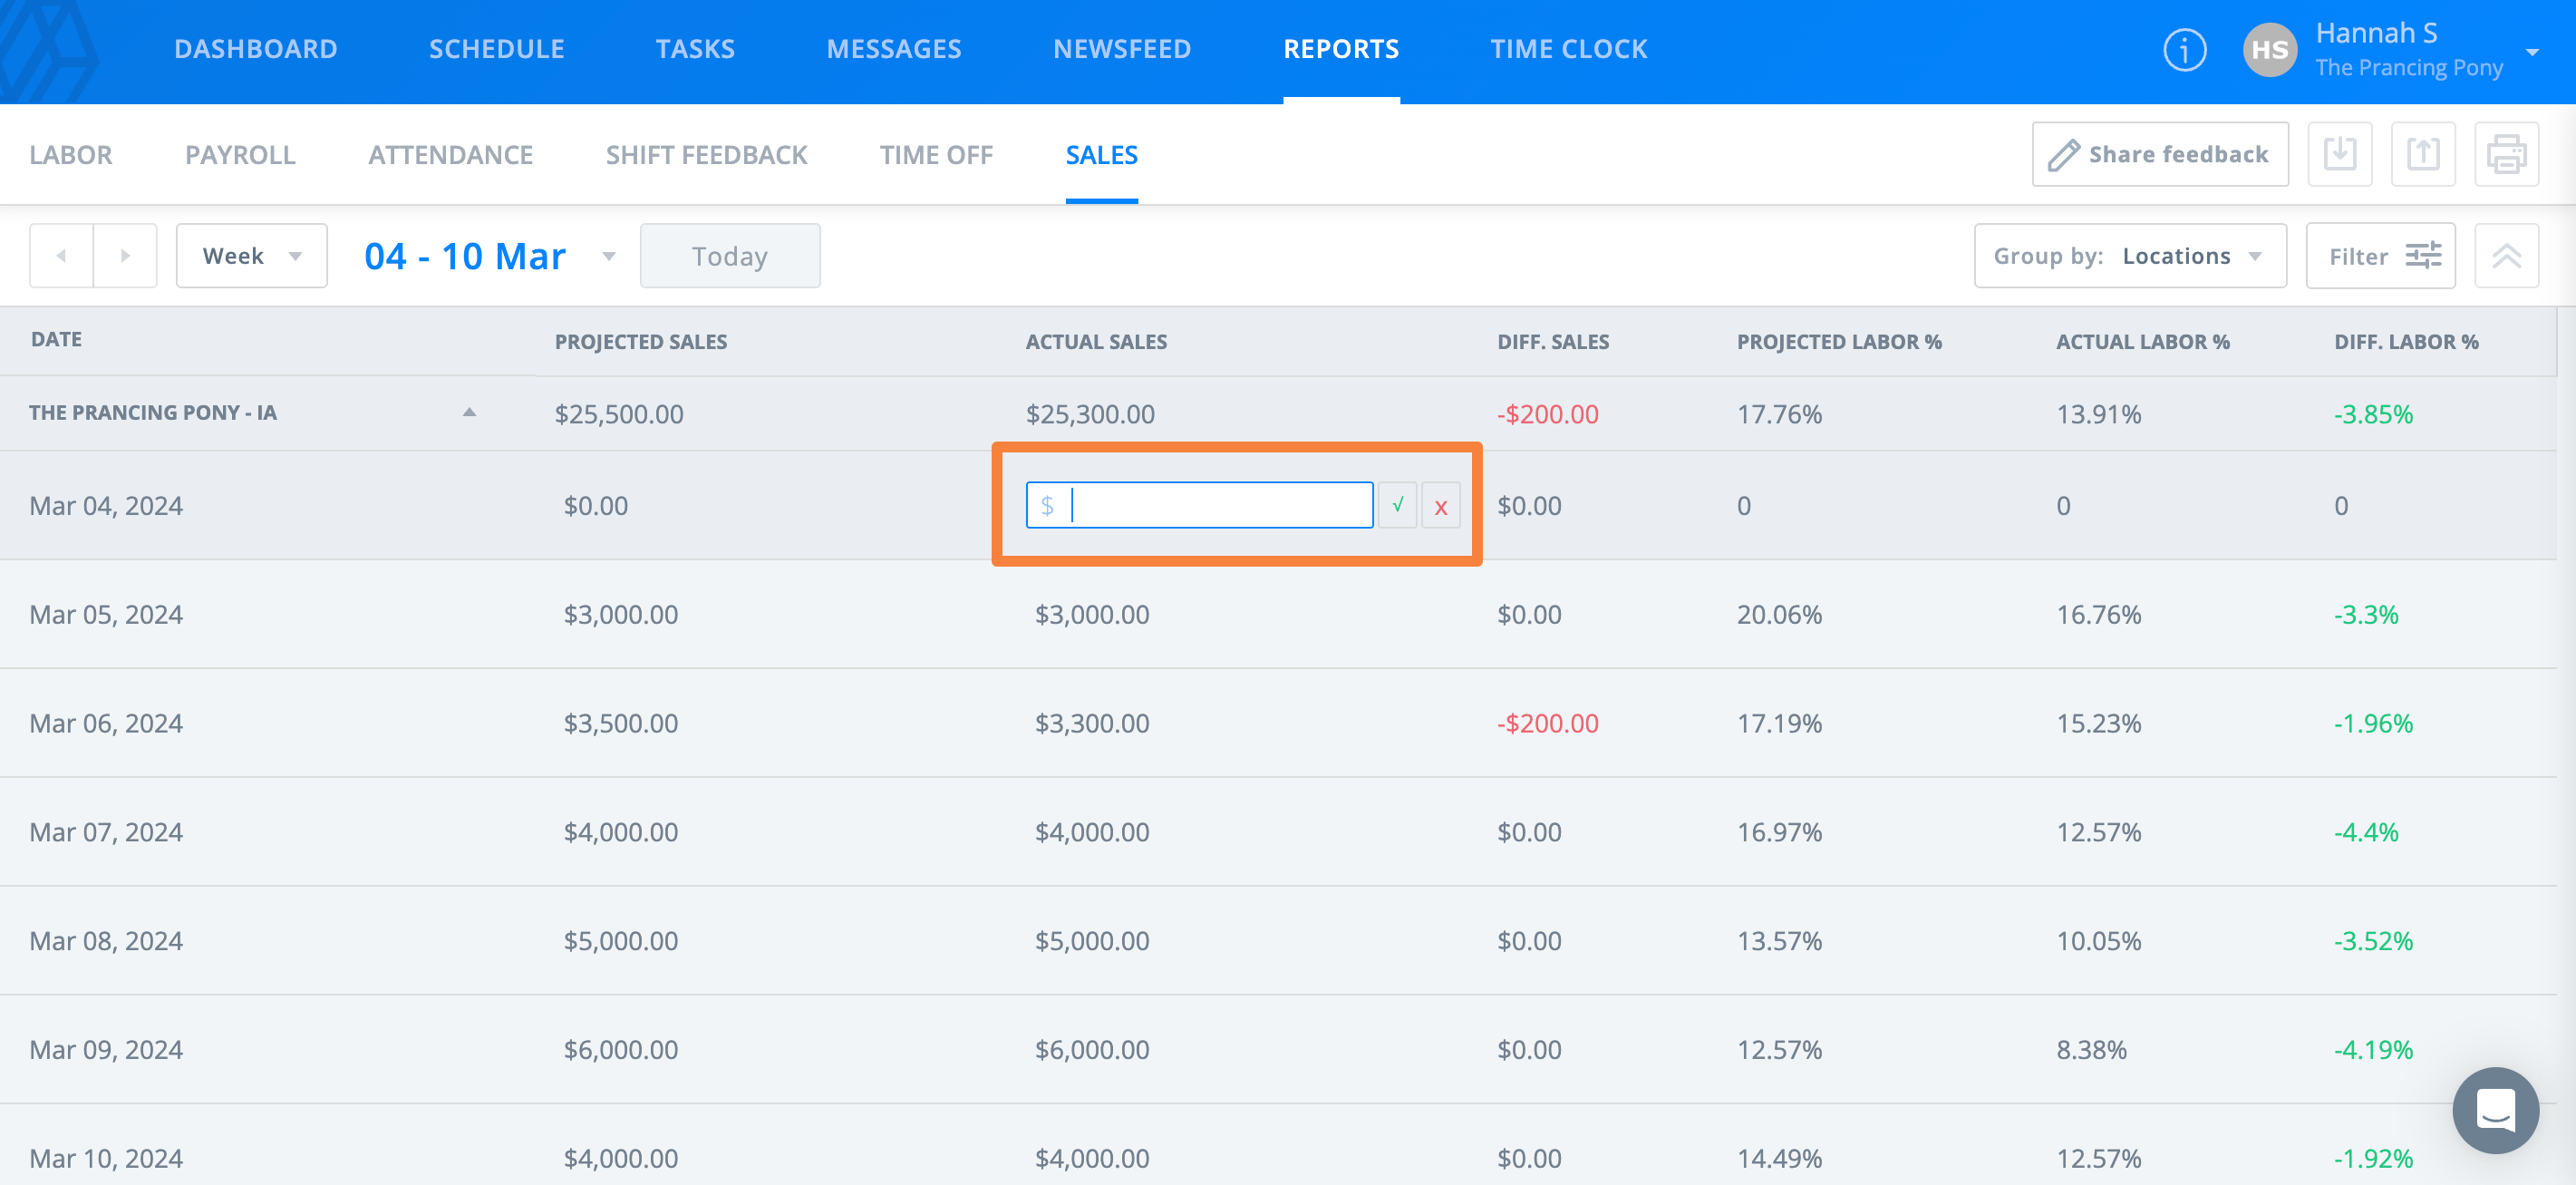
The Sales report allows you to compare projected and actual sales figures so you can see how your business is performing. You can also compare labor cost percentages if you have set a labor cost goal. Sales amounts can also be uploaded or edited by date in this report.
Customize Reports
In addition to multiple date ranges, location, and sorting options, the Reports feature allows you to choose which columns of data you want to view, whether you want to view totals in hours and minutes or decimal format, and whether you want to view a grand total or details.
- Choose the columns that appear
- To choose which columns appear in your reports, select the Filter button, then open the Columns menu. There, you can select or clear the items you want to view. Each report, such as Labor or Payroll, can be customized separately.
- You can select and drag different column headers to adjust the order of the list.
- View data in hours/minutes or decimal format
- To choose how hour totals are displayed, select the gear icon in the upper right corner, then adjust the toggle next to Decimal format.
- View totals or details
- Select the gear icon in the upper right corner and adjust the toggle next to Show totals. When enabled, you see only a grand total for the data. Depending on the Group by option you choose, the way the data is listed changes.
Add Sales Data
The Reports tab includes a section for sales data, which allows you to track projected and actual sales to help with labor cost budgeting. There are two ways to add sales data to your Sling account. You can upload your sales data or manually enter it.
Upload Sales Figures
If you already have a file, or if you can export the data from another software, you can upload it into Sling. To upload sales figures:
- From the Reports page, make sure you are viewing the Sales tab.
- Select the Import button and choose the import option you prefer, either actual or projected.
- Choose the file from your device.
- Tell Sling how the data is aligned in the file:
- Horizontally if dates are listed across the top of the spreadsheet
- Vertically if dates are listed from top to bottom
- On the next screen, label the columns or rows, choose any rows or columns to exclude, and select the date format.
- If your file includes several locations, label them so Sling applies the correct figures to the correct location.
- Select Next to review the import summary.
- If everything looks correct, select Import Sales.
- If the import is successful, you will see a confirmation message.
Notes:
- It is best if the file is formatted as plain text.
- Dates should not include extra zeros. For example, use 1/7/2021 instead of 01/07/2021.
- Sales amounts should not include a thousands separator. For example, use 1500.00 instead of 1,500.00.
Edit Sales Data Manually
If you plan to update sales manually each day or make a change to a specific date, you can edit the data directly from the Reports page.
- Find the date you need to edit under the Sales tab.
- Hover over the data until the pencil icon appears.
- Select the pencil icon and enter the new data.
- To save the change, select the green check button or press Enter on your keyboard.
- To cancel the change, select the red x button.
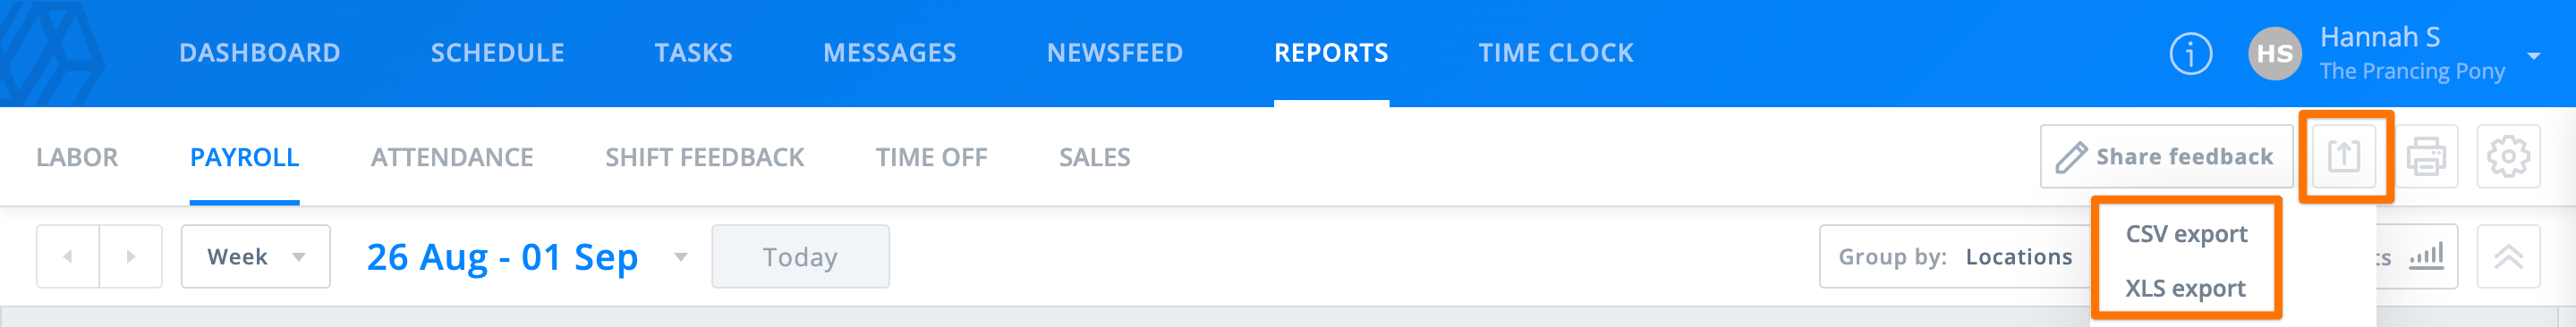
Export Payroll
Payroll reports are generated based on time clock activity, so employees must punch in and out using the Time Clock, or you must manually enter their time. Once that information is recorded, you can choose any date range to export from Reports > Payroll. You can also customize the appearance of the report to format the data to meet your needs. You can export the data as an XLS or CSV file and then upload it to your payroll processing service.
Compare Payroll and Timesheets
The Payroll report is a summary of actual wages for each employee that lists total earnings for the selected date range. Actual wages are determined by time clock activity, so it is not possible to run a Payroll report based on scheduled hours unless you manually enter employee timesheets. The information can also be exported so you can upload it to your payroll processing software or service.
Timesheets, located under the Time Clock tab, list every scheduled shift for the selected range and show any time clock activity recorded through Sling's Time Clock feature. You can filter Timesheets by location, position, group, employee, tags, auto clock-out, and status. You can edit this information, including adding, removing, or editing start, end, and break times, and the changes are reflected in your Payroll reports.