xtraCHEF: Get Started With Spending by Vendor Analytics
Last updated: Apr 28, 2026, 4:19 PM
Spending by Vendor Summary
With all the moving parts of the hospitality industry, it can be easy for certain spending habits to fall through the cracks or go unrecognized. With xtraCHEF, you can quickly review and manage where and how your organization spends money to better control where vendors and invoice items impact your bottom line. Read on to learn more about how you can use your Spending by Vendor analytics to gain broad insights and granular data to help you make informed decisions about your spending.
To access your Spending by Vendor analytics, navigate to Reporting in the left-hand navigation of xtraCHEF and scroll down to the Cost visualization section to select Spending by vendor.
Here, you'll be able to access increasingly granular analytics. Before diving into this report, it's important to note that your data set will default to your first location and the current week of spending. Right away, you can adjust the location and date range. Once changed, be sure to select Refresh in the upper-right corner.
With your location(s) and date range selected, you're ready to explore Spending by Vendor.
Back to top
Vendor View
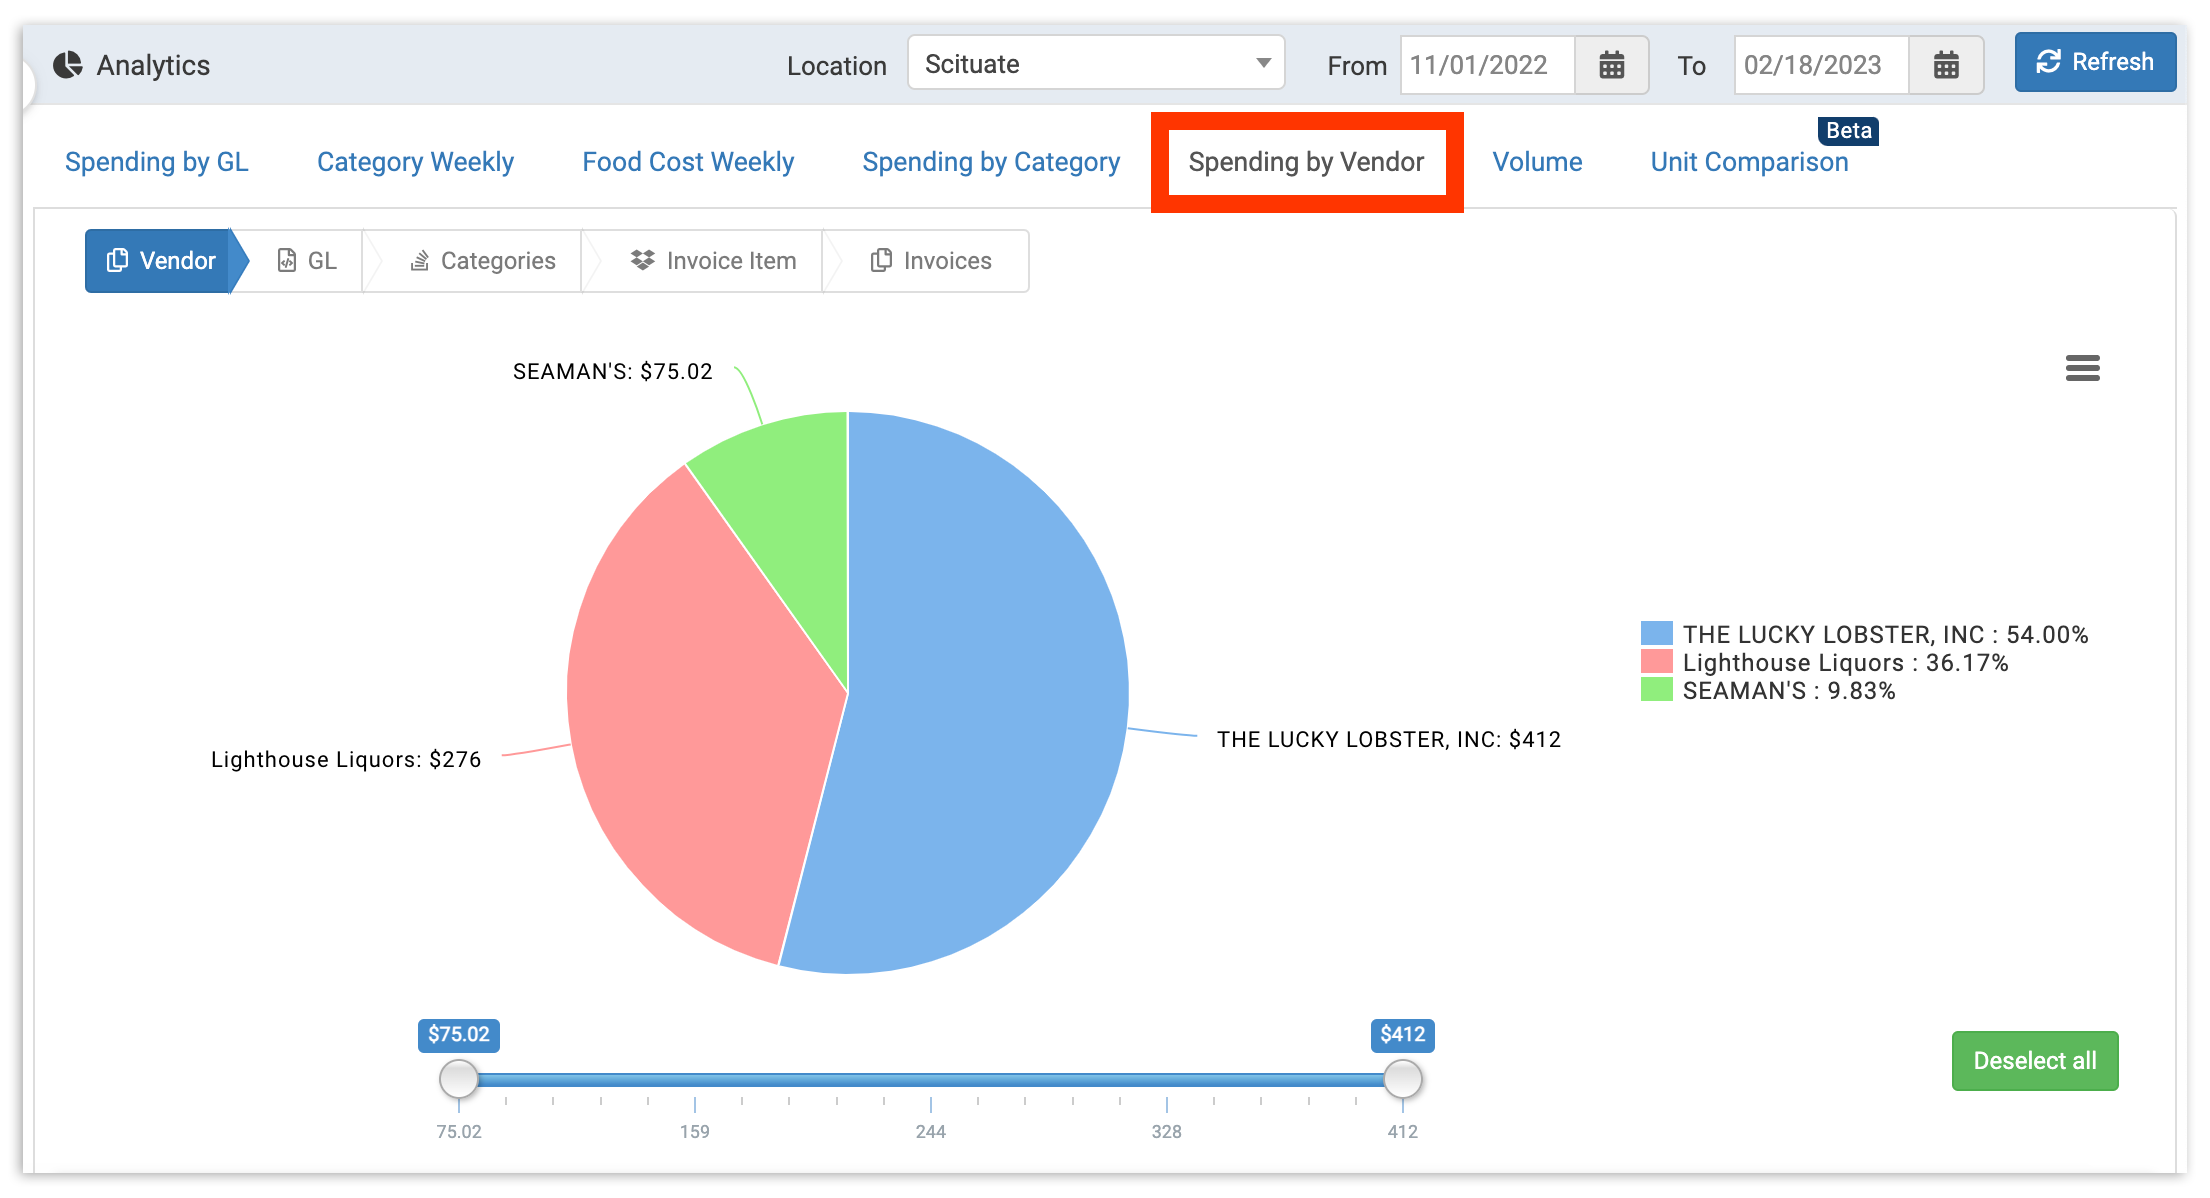
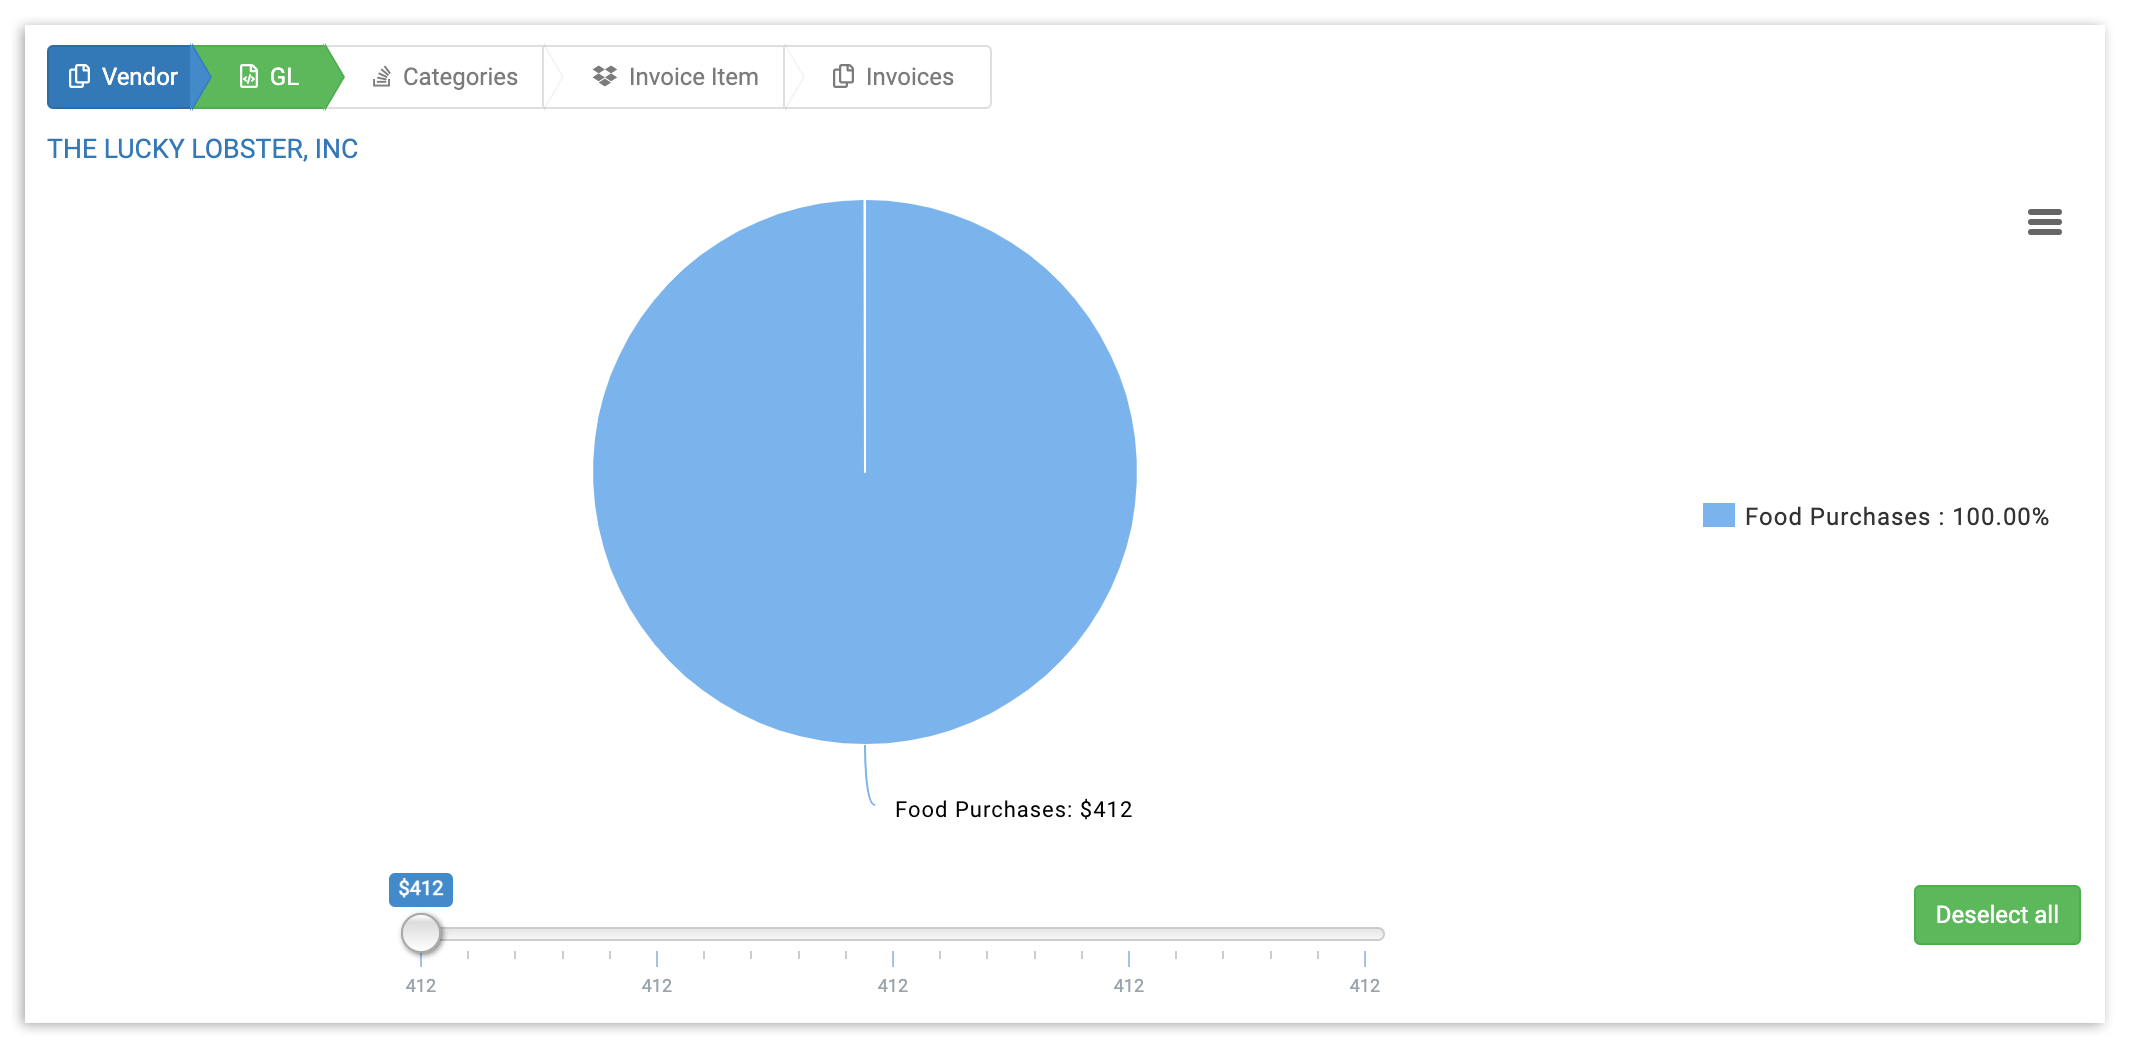
By default, data will be displayed by the vendor (Vendor view). This view will display a pie chart and a table outlining your overall spend by vendor.
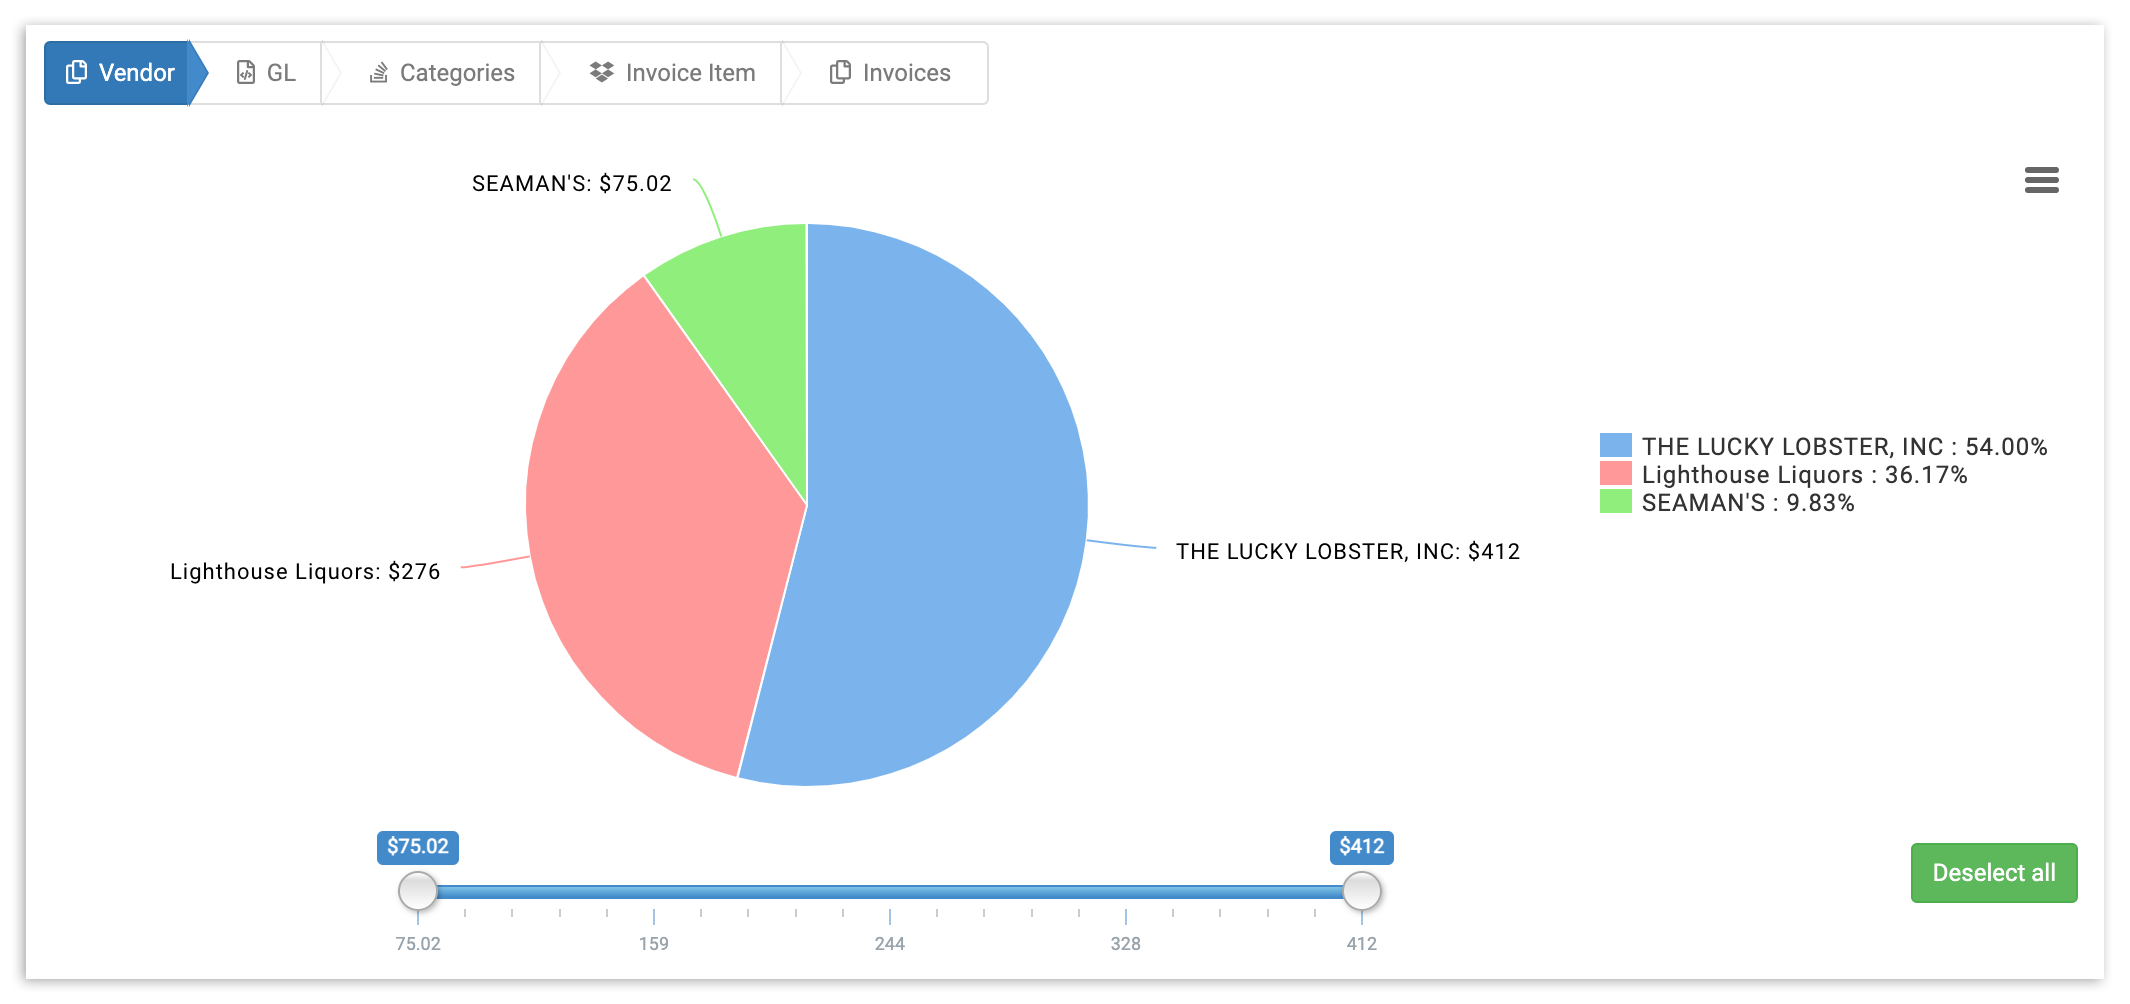
To further customize what's shown here, you can segment this data by using the Vendor List to remove any vendors. Doing this will automatically update your data to exclude them from the pie chart and table. If you have a lot of vendors, it may be easier to select Deselect all on the right side of the page and add back any vendors you'd like to see.
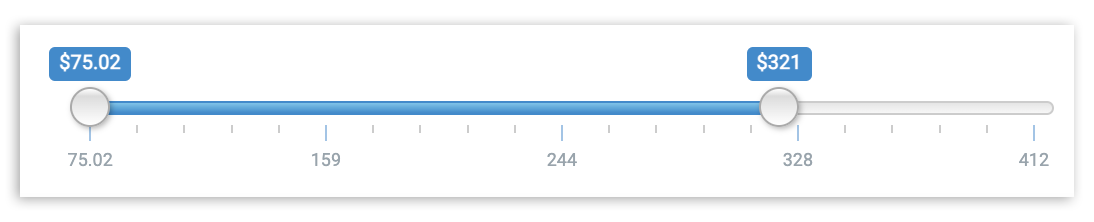
You can also toggle with the Amount Section Slider to adjust the slider to include only vendors who fall within a specific price range. Any vendor whose total invoice amount falls above or below the parameters you decide will automatically be excluded from the pie chart, allowing you to drill down on key spending areas.
GL View
Want to get deeper insights into your spending by vendor? Start by opening the GL view by selecting any vendor in your pie chart. This will automatically update your view and allow you to see which general ledger (GL) codes your spending falls within for that specific vendor. You can select the vendor name from the table beneath the pie chart.
As with the Vendor List view, in GL view, you can customize your data by selecting or deselecting GL codes and adjusting your price range to get a narrower view of certain spending areas.
Back to top
Categories View
In xtraCHEF, custom categories can be assigned within your GL codes to further breakout your spending for xtraCHEF reporting. For example, you may use custom categories within a GL code titled Food Costs to break out protein costs, produce costs, dairy costs, and canned goods costs as sub-categories.
If you've implemented custom categories, you can dive further into your spending by the vendor by selecting a GL code from your GL view. This will launch the Categories view and show how much money per category makes up the total GL spend.
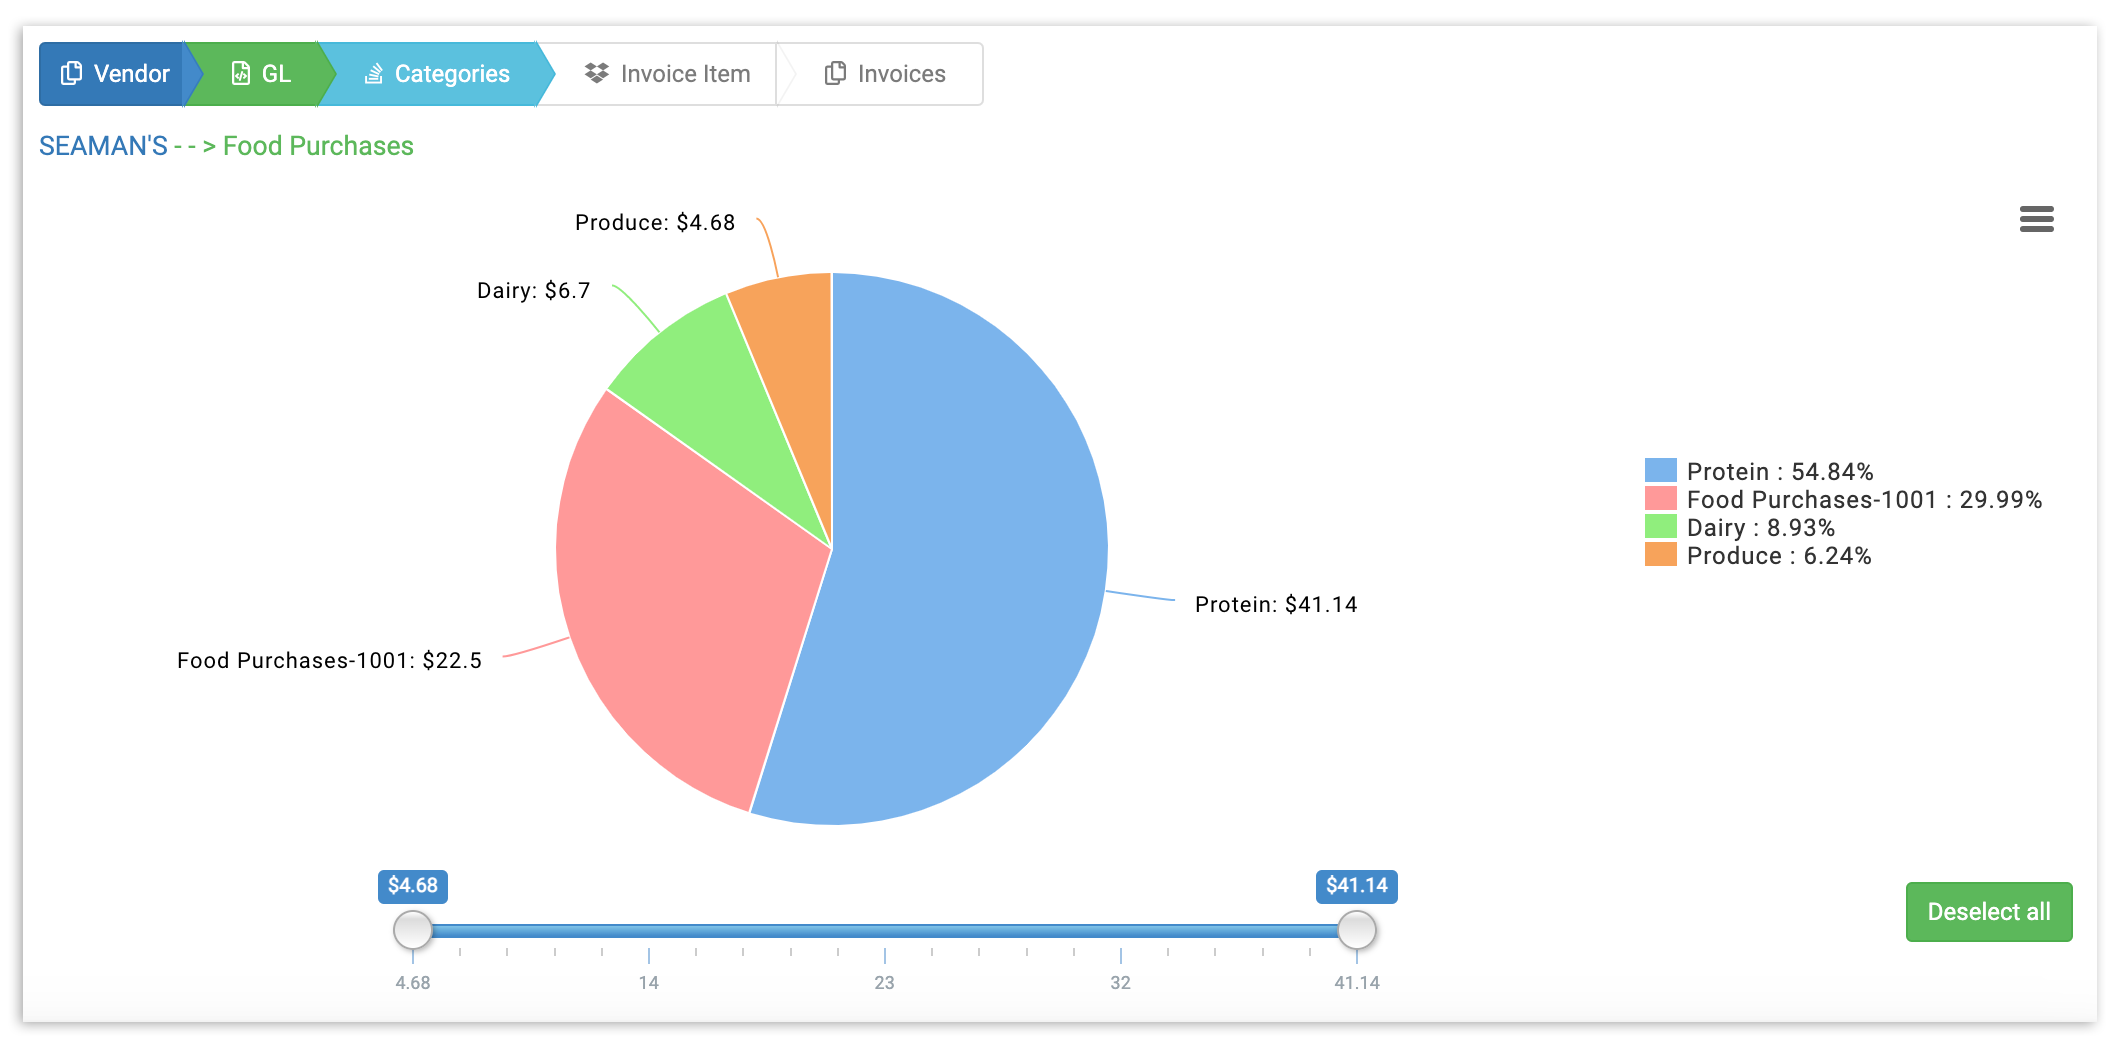
In Categories view, you can once again narrow your results by deselecting specific categories or establishing a price range.
Back to top
Invoice Item View
In xtraCHEF reporting, your invoice items exist within custom categories. To see those, select a category in the pie chart or table. This will automatically populate your Invoice Item view.
Invoice item view allows you to see exactly what you're buying on the most granular level and unlock insights like how much of your food costs are impacted by unexpected or rising ingredient prices or whether your monthly utility bill is putting your location's profitability at risk.
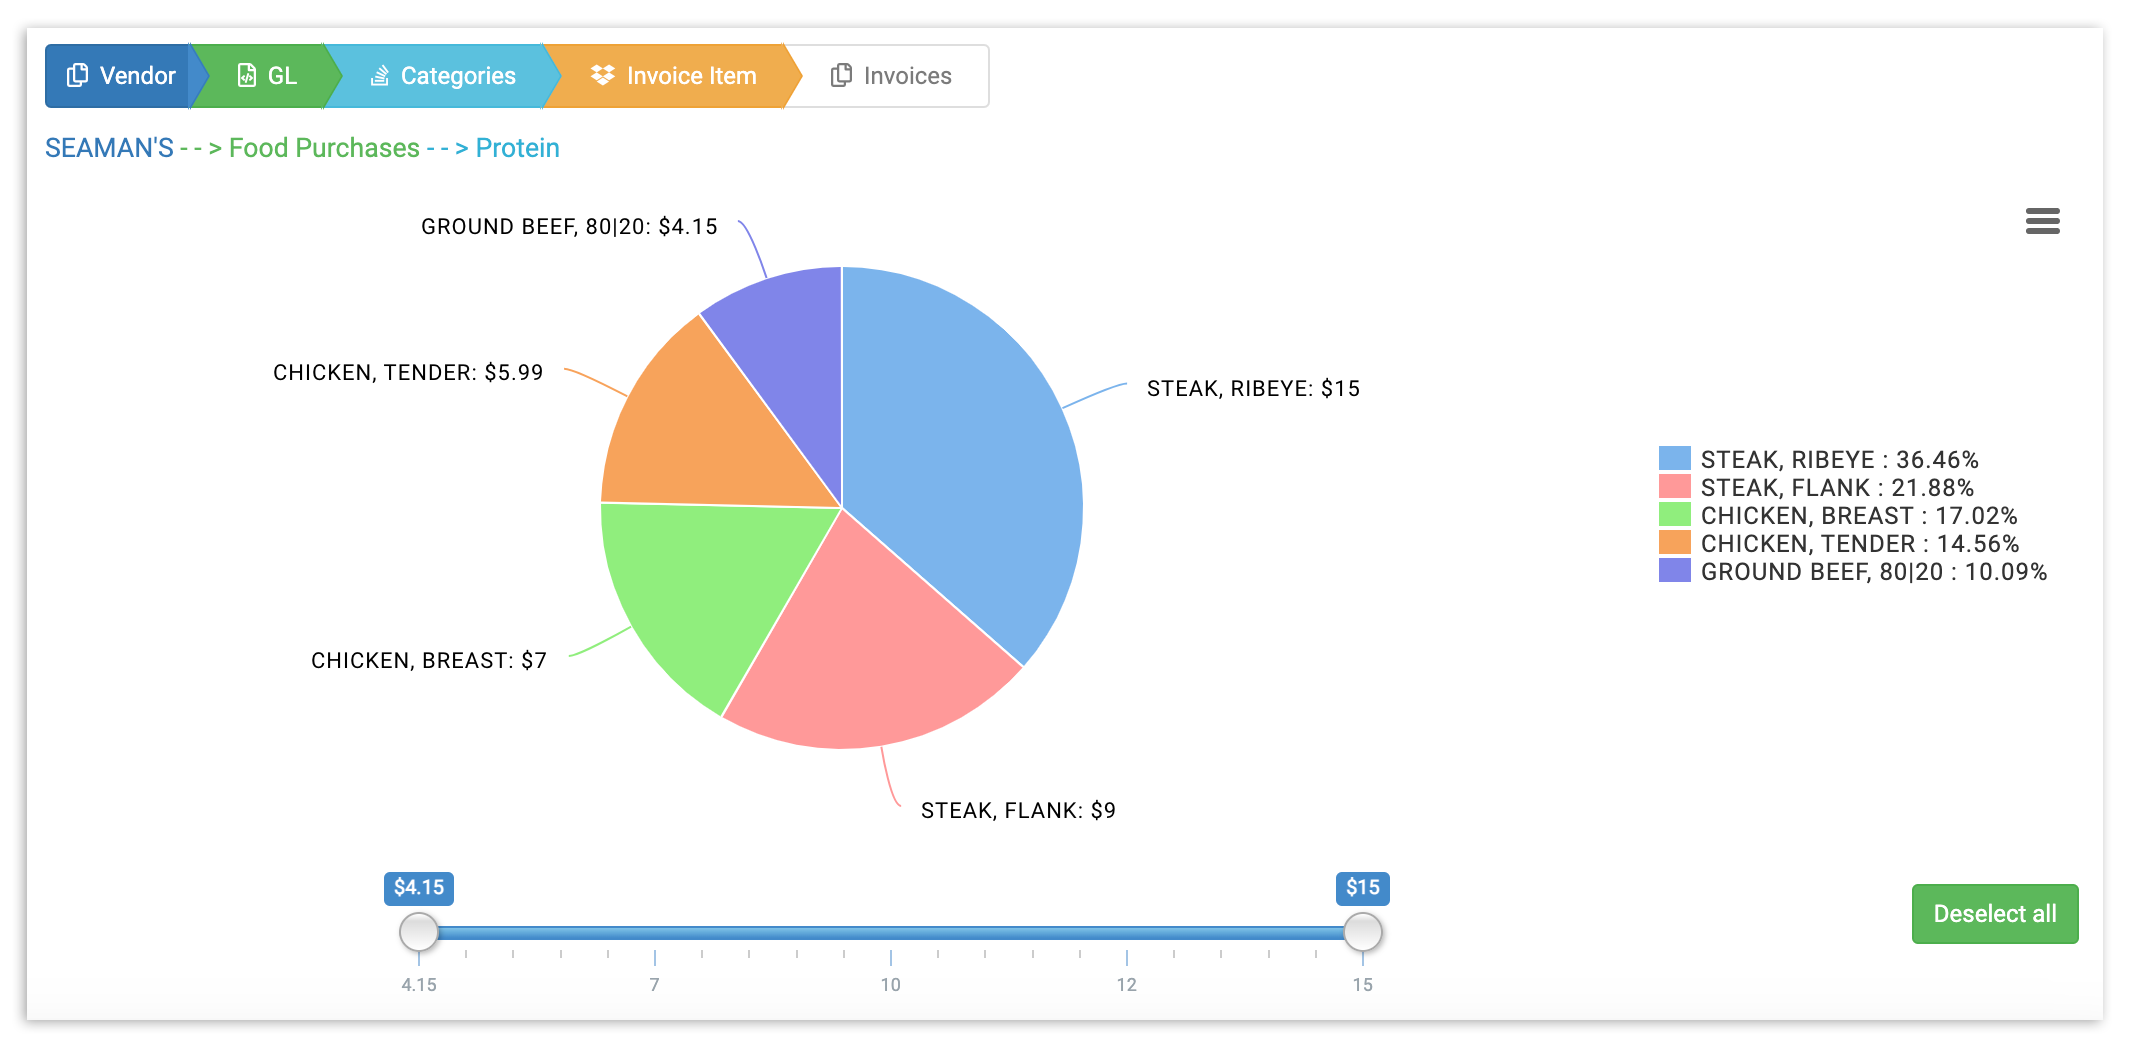
Similar to all other views in this report, you can tailor your insights by deselecting items and adjusting your price range.
Back to top
Invoice View
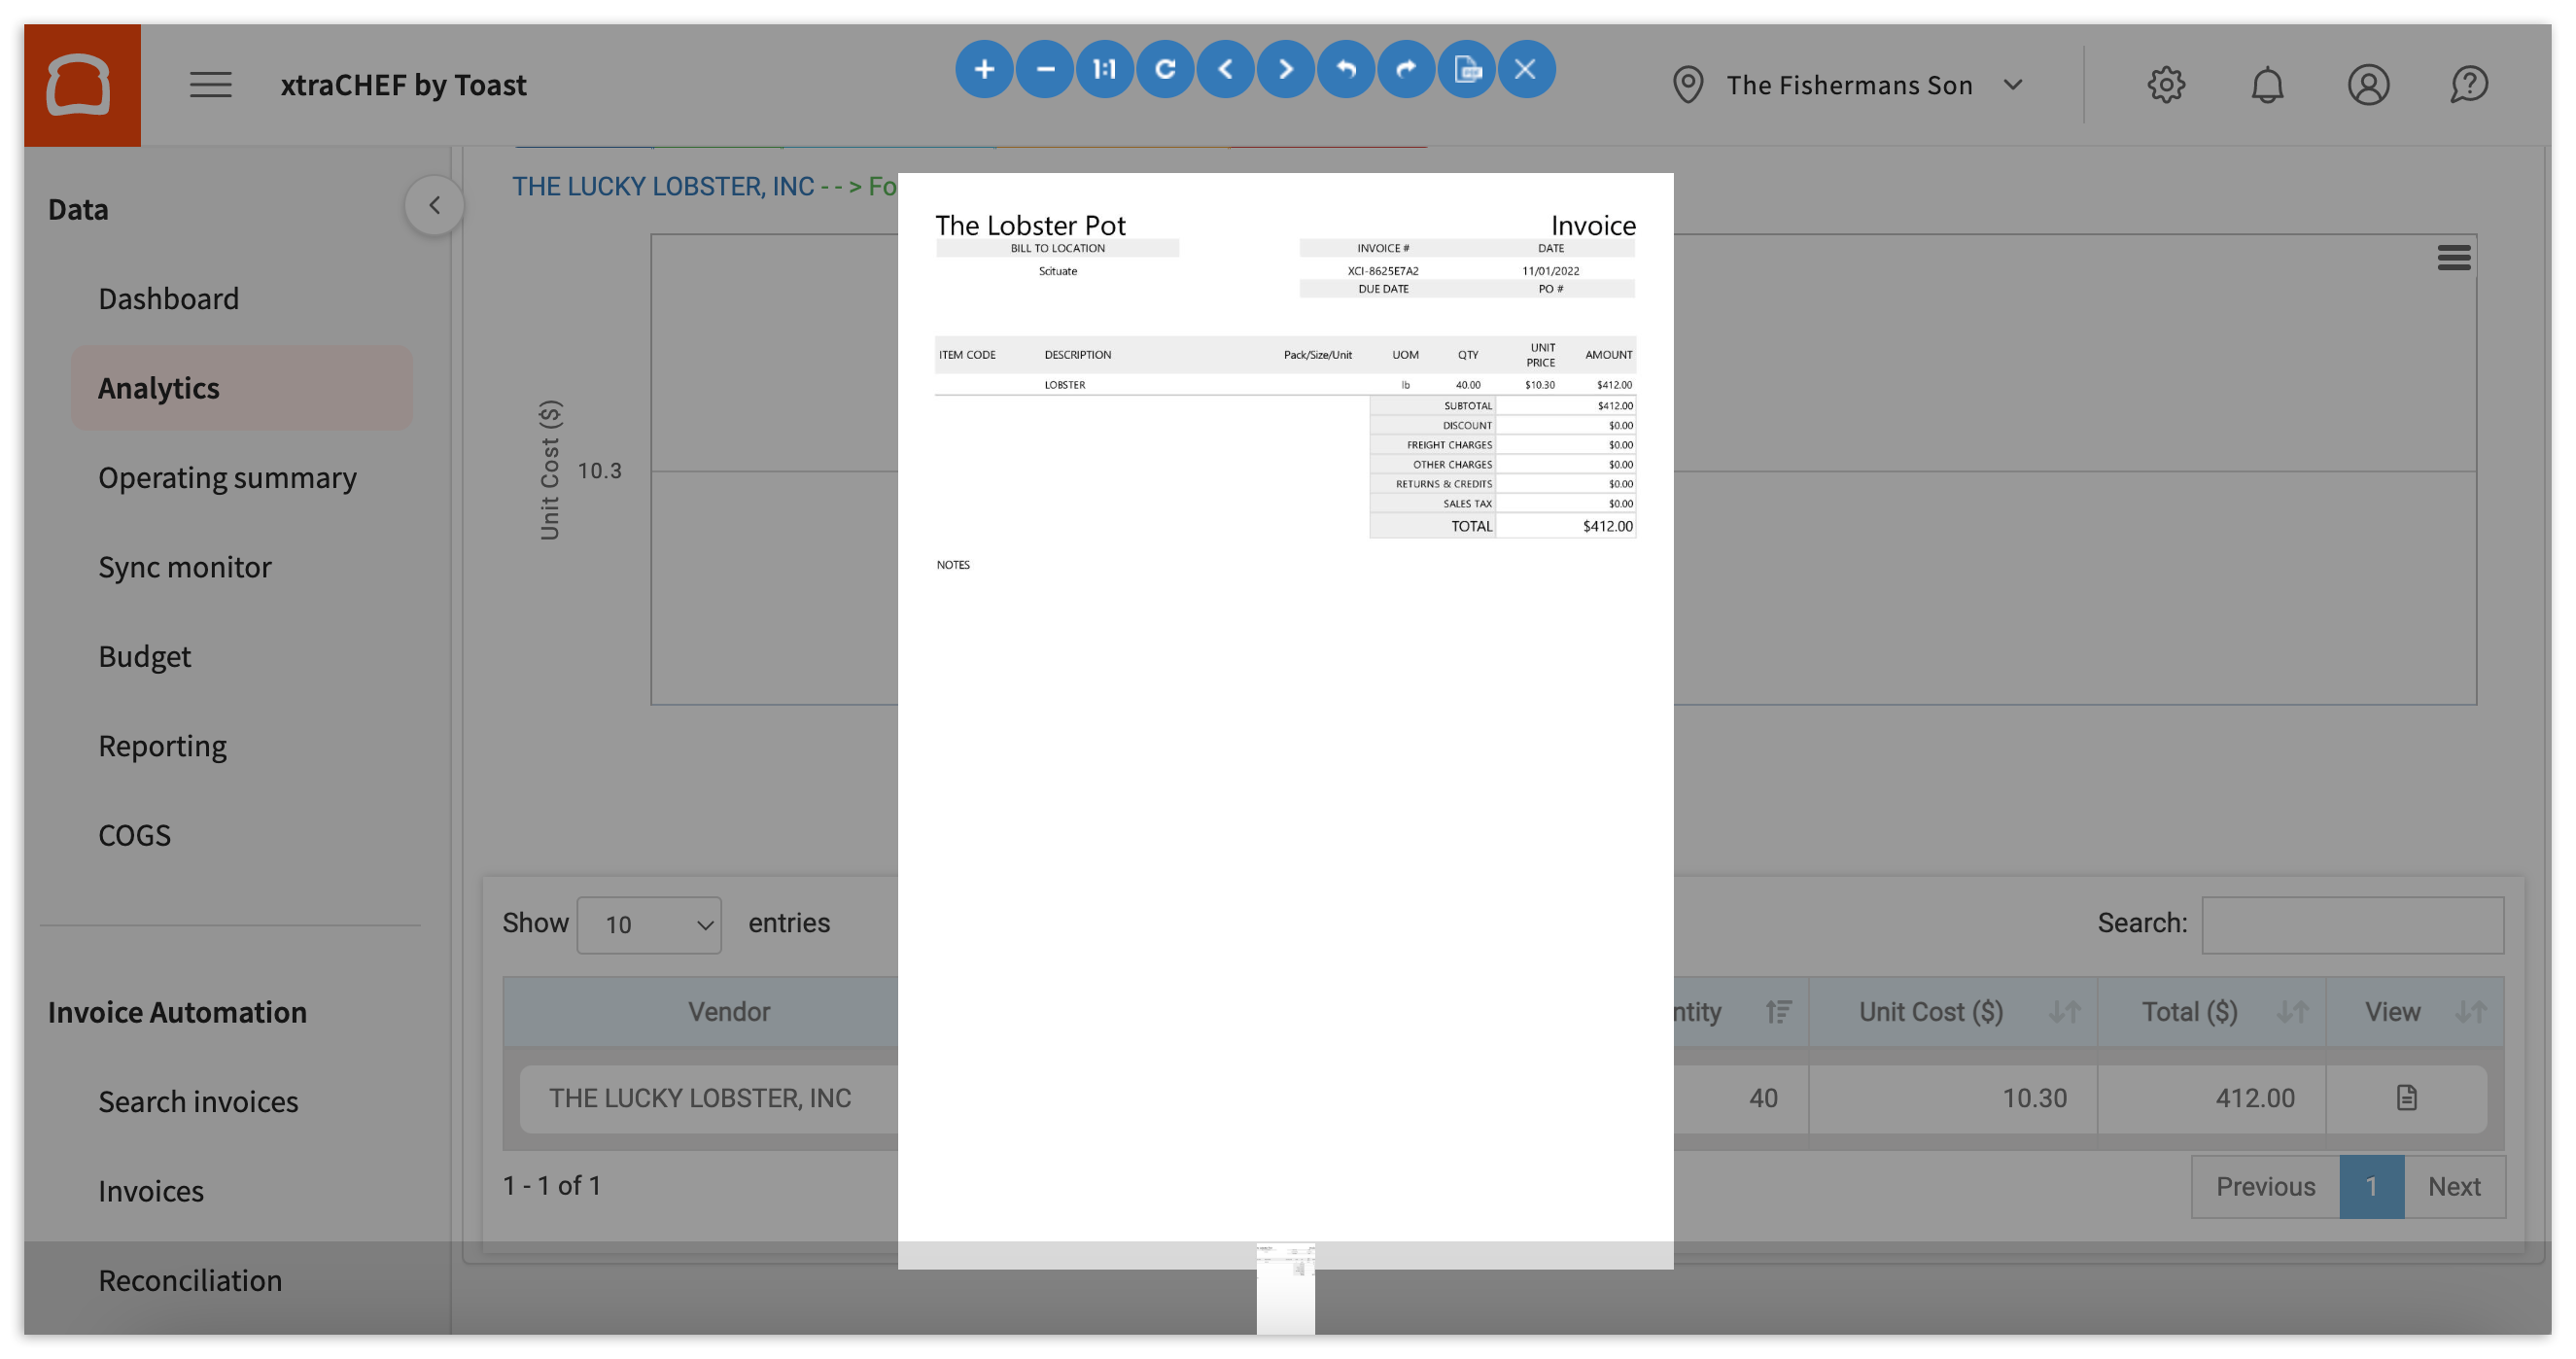
Did an invoice item cost surprise you? Double check the data and crunch any necessary numbers by selecting a specific invoice item in either the pie chart or your data table. Doing so will populate a view of all the invoices that contributed to the final numbers for your invoice item spending. Hover over the timeline for a bird's eye view of the totals, or click on the data point to pull up the scanned invoice.
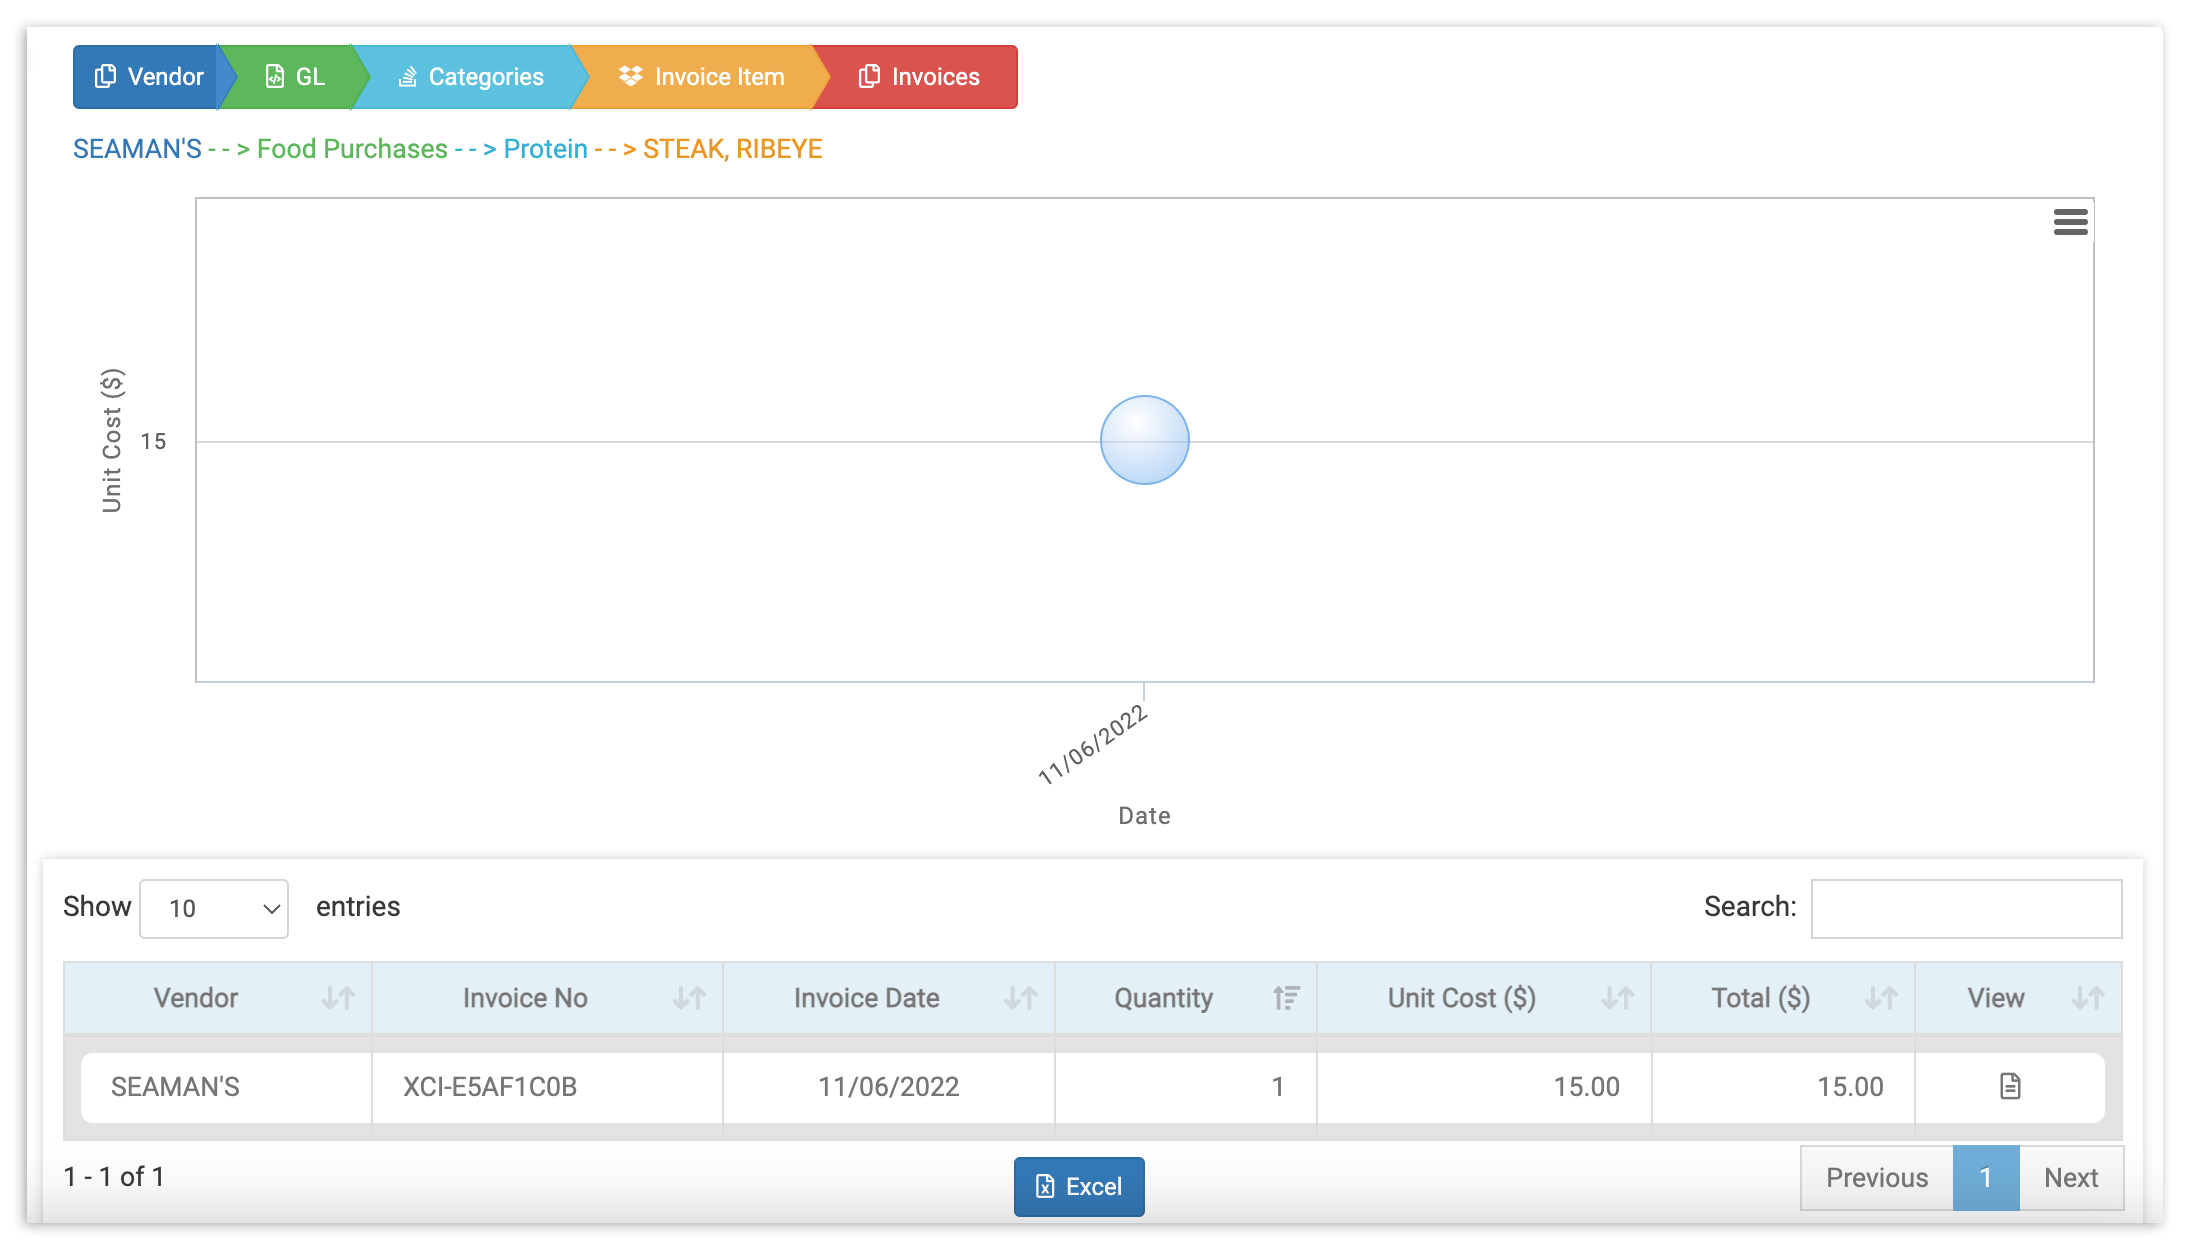
You can also view your originally scanned or uploaded invoice by selecting the View icon in the table's right-most column.