xtraCHEF: Comience con el análisis semanal de categorías
Última actualización: 8 abr 2026, 10:05 a.m.
- Resumen semanal de categorías
- Vista de resumen
- Vista semanal
- Detalles de los artículos de la factura
Resumen semanal de categorías
Sus análisis de categoría semanal le brindan datos a simple vista y detallados sobre dónde está gastando semanalmente. Exploremos cómo acceder a sus análisis de categoría semanal y dónde encontrar la información que necesita.
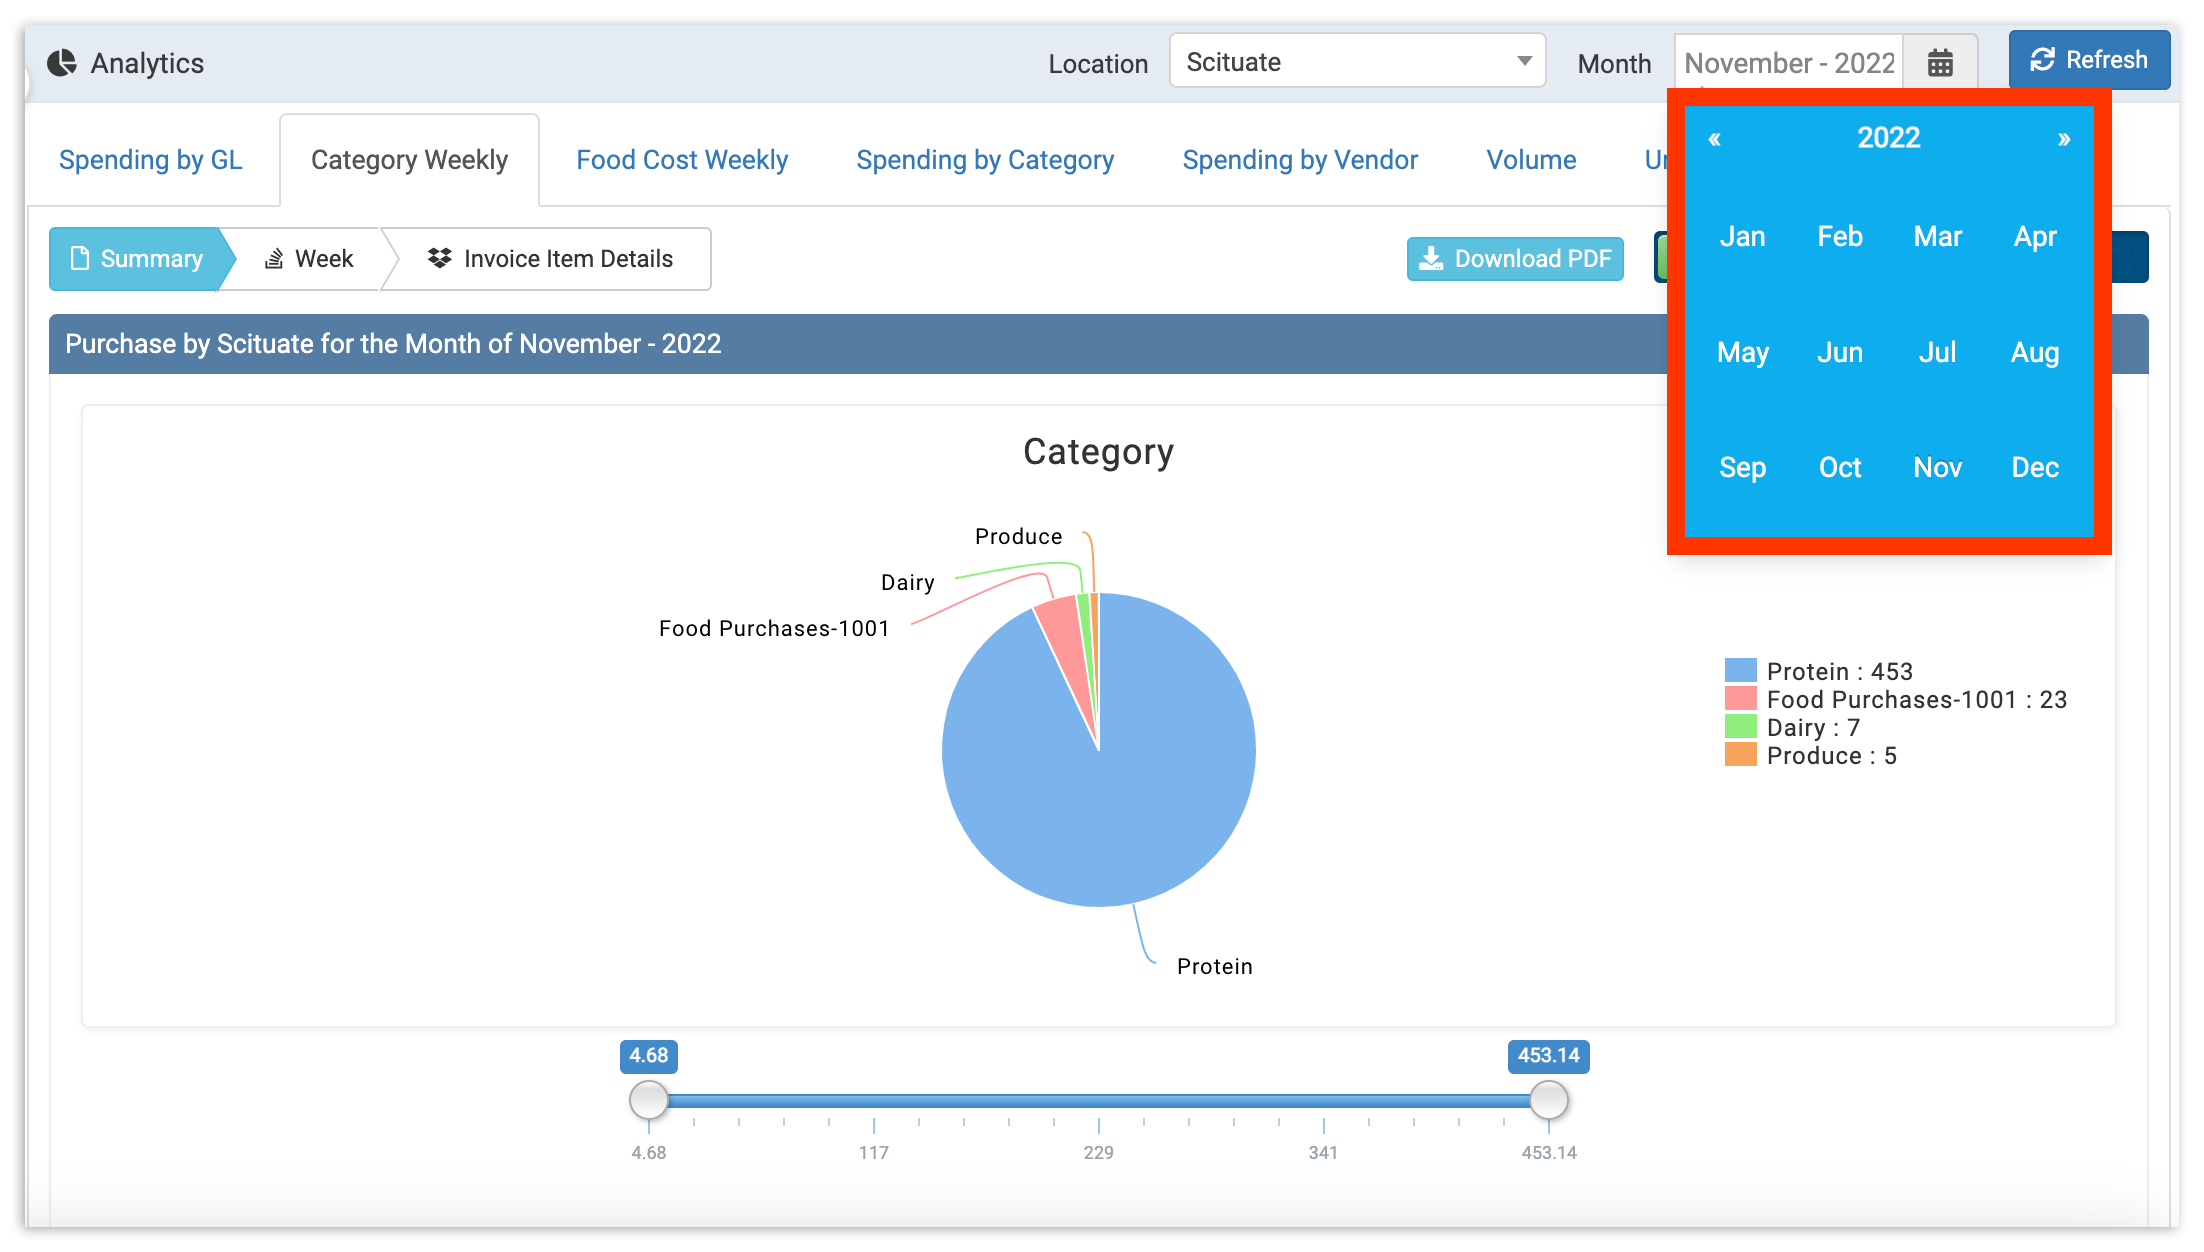
- Para comenzar, primero navegue a la pestaña Analítica en la navegación de la izquierda de xtraCHEF. A partir de aquí, seleccione la pestaña categoría semanal.
- Una vista de resumen de este conjunto de datos se mostrará. Esta vista muestra el gasto del mes hasta la fecha dividido por categoría.
- Por defecto, la categoría semanal mostrará el mes/semana actual. Sin embargo, puede revisar meses anteriores cambiando su rango de fechas seleccionando el icono de calendario en la esquina superior derecha.
- Por defecto, la categoría semanal mostrará el mes/semana actual. Sin embargo, puede revisar meses anteriores cambiando su rango de fechas seleccionando el icono de calendario en la esquina superior derecha.
- Después de seleccionar un nuevo rango de fechas, seleccione Actualizar. También puede alternar entre vistas seleccionando Periodo hasta la fecha o Mes hasta la fecha (su vista predeterminada) utilizando el control deslizante en la esquina superior derecha.
Vista de resumen
La vista resumen contiene un gráfico circular y una tabla, que le permiten entender dónde su organización está gastando más dinero mensualmente. Utilice el gráfico circular para obtener una visión visual rápida de qué categorías constituyen la mayor parte de su gasto.
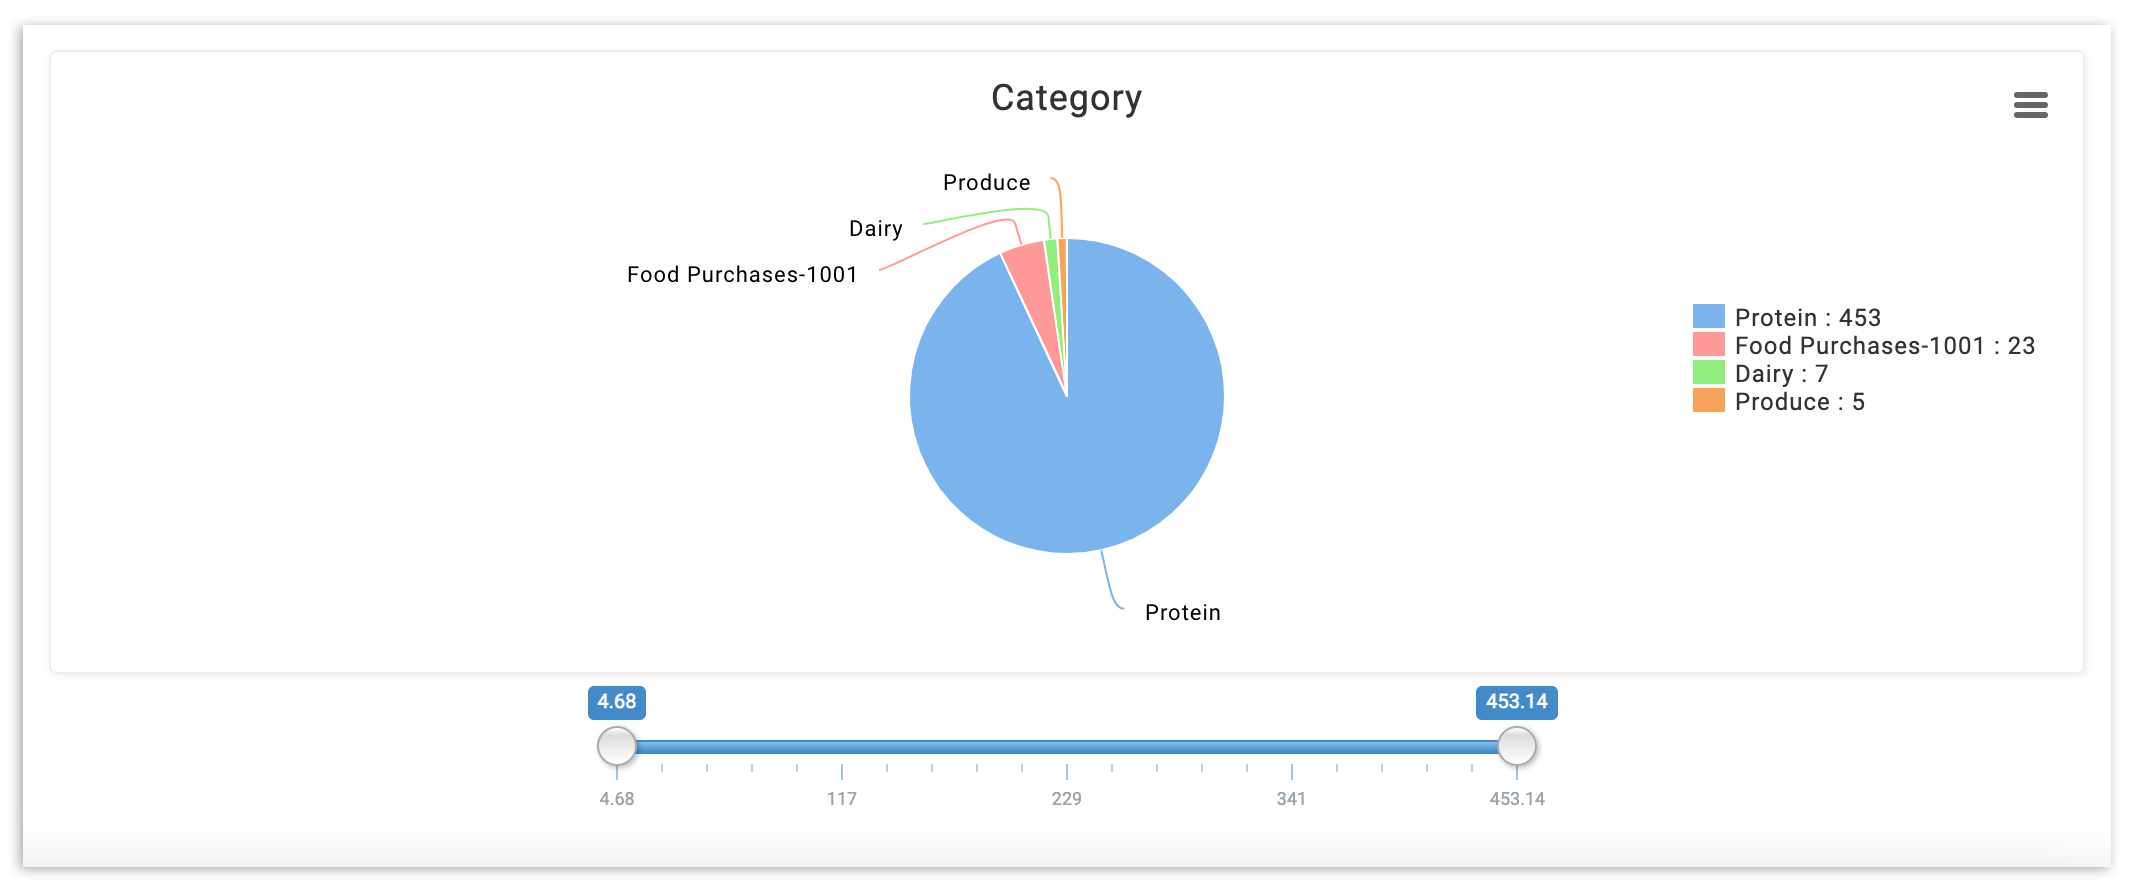
Este gráfico se actualizará cada semana a medida que se agreguen nuevos datos durante el mes. Para ver gráficos de meses completados, selecciona el mes que deseas ver en el selector de fechas en la esquina superior derecha y selecciona Actualizar.
Debajo del gráfico circular, encontrarás una hoja de cálculo con tus gastos semanales divididos por categoría.
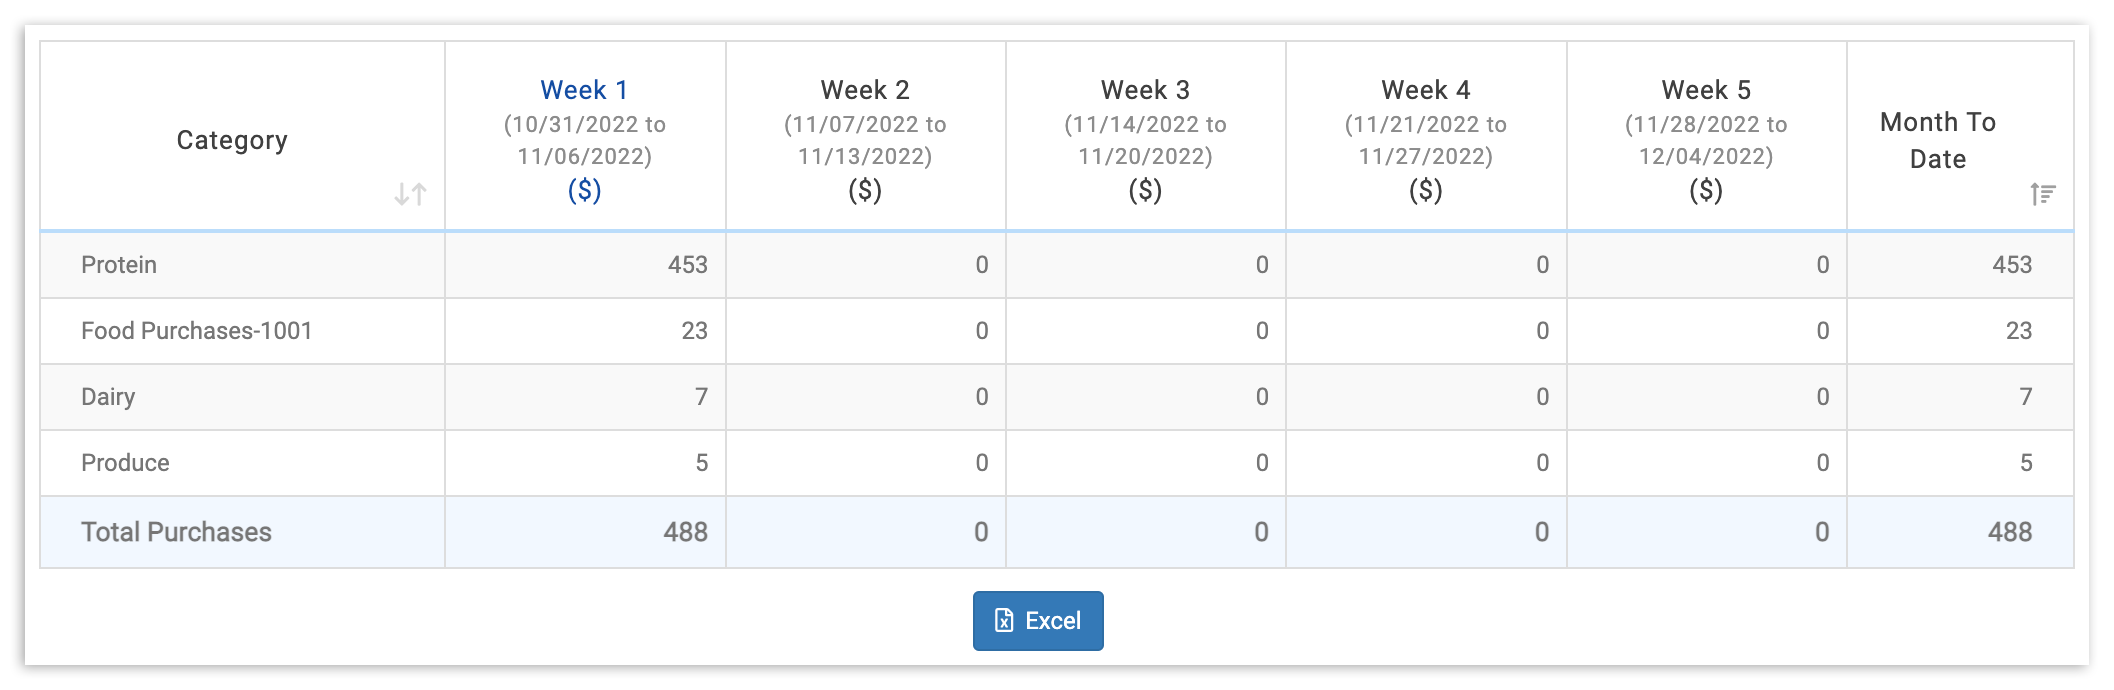
Para obtener más información sobre los datos de cualquier semana, simplemente selecciona la columna del encabezado de la semana. Esto te llevará de la vista Resumen a la vista Semana. También puedes seleccionar el encabezado y el ícono de Semana.
Vista de Semana
En Vista de Semana, encontrarás tu costo por día desglosado por categoría y proveedor.
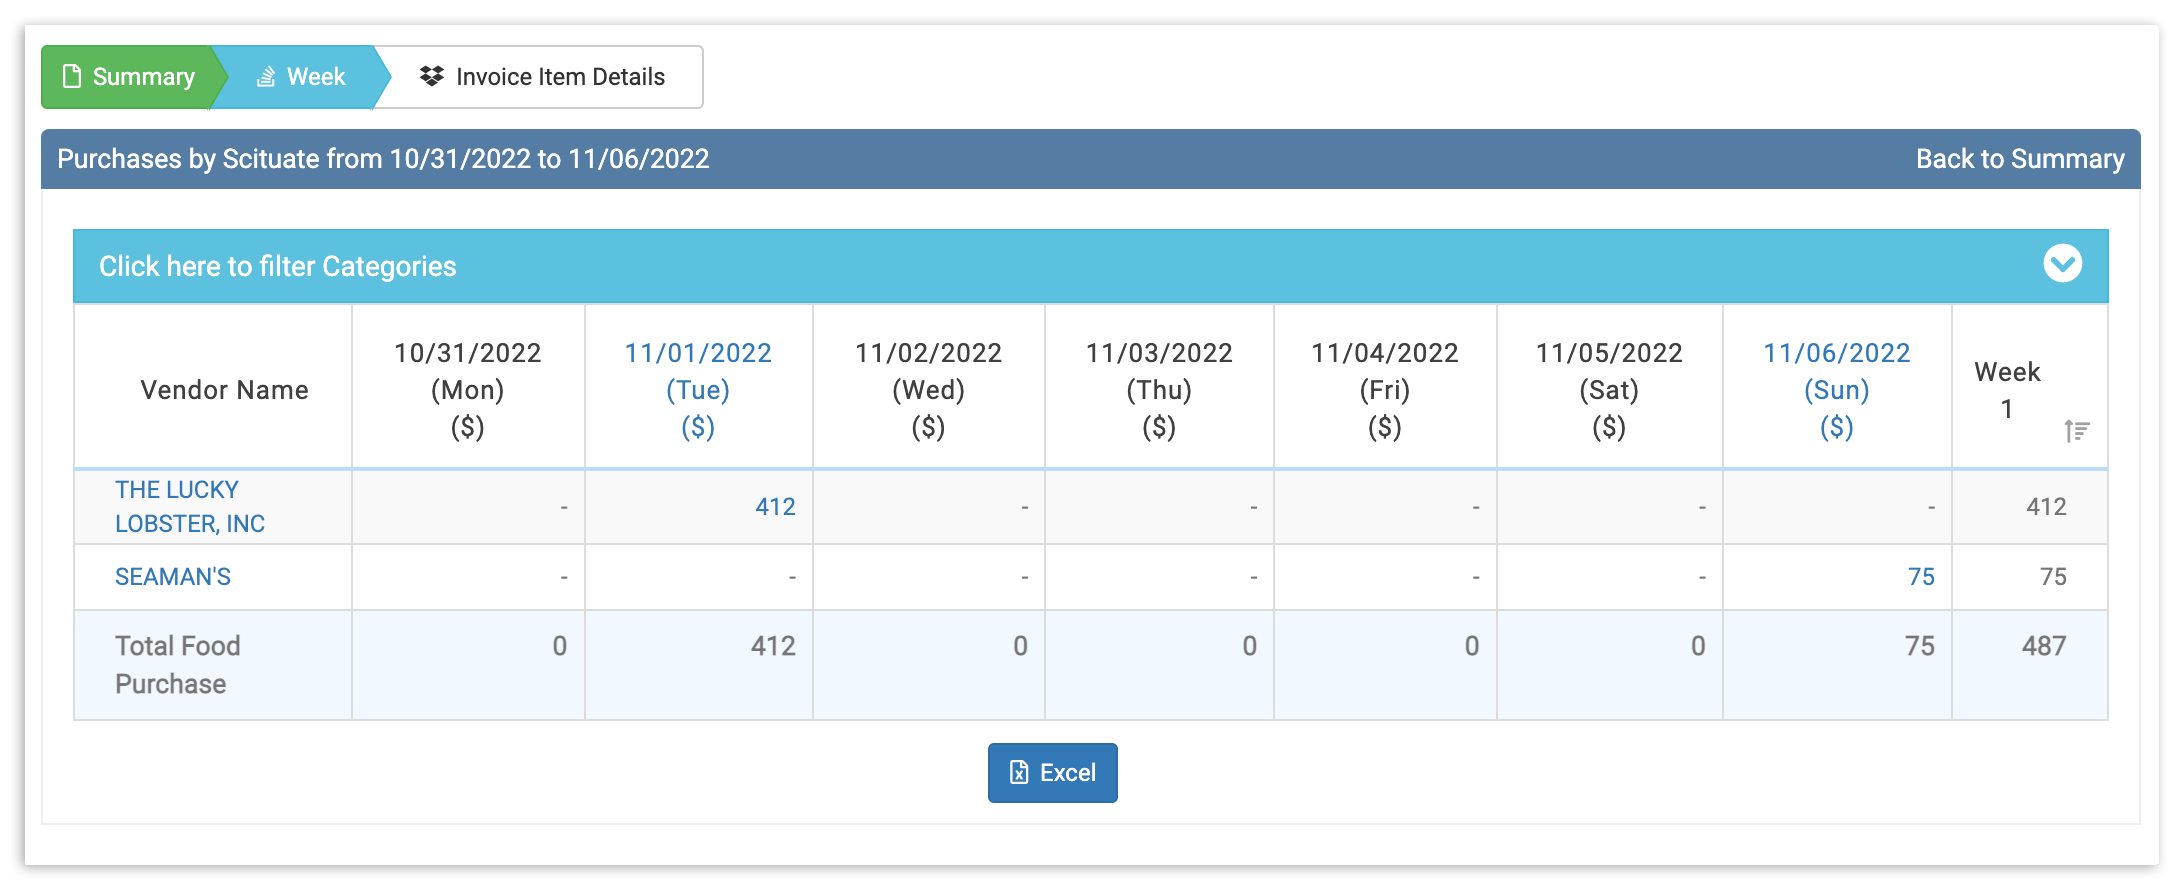
Para profundizar aún más, selecciona ya sea una fecha o un proveedor para mostrar una vista de Detalles del Artículo de Factura.
Vista de Detalles del Artículo de Factura
Tu vista Detalles del Artículo de Factura proporcionará un desglose completo y granular de los gastos para un día en particular. Para ver cualquier factura, simplemente selecciona el ícono Ver dentro de la columna Ver.
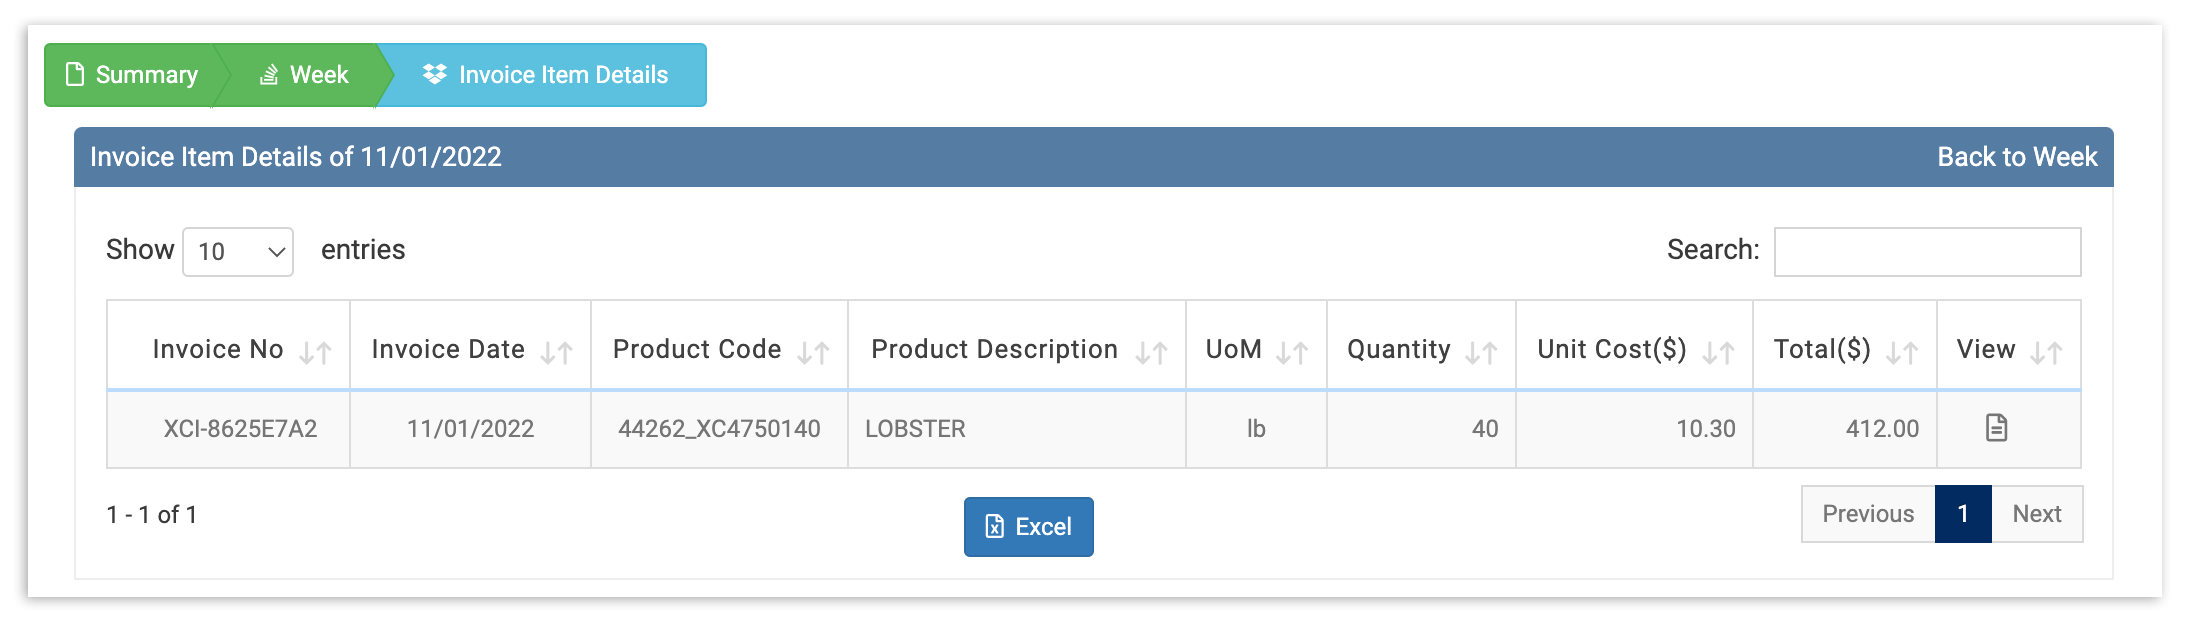
Esto te dará información sobre tus gastos semanales con ese Proveedor o Fecha dependiendo de tu selección. Utiliza tus datos de gastos semanales por categoría para rastrear cómo cambian tus gastos con el tiempo, entender cuáles son tus artículos de mayor costo y anticiparte a cualquier tendencia preocupante en tiempo real.