翻译仅供参考。您与 Toast 签署的任何法律协议(包括但不限于《商户协议》和《终端用户许可协议》),其订立语言可能不同于以上页面所使用的语言,无论是否提供本页面其他语言的译文,均应以您所签署的协议条款为准
厨房运营报告概述
上次更新时间:2026年5月4日 11:38
如果您拥有厨房显示系统,您可以运行报告以查看完成订单所需的时间、哪个备餐站占用时间最长,以及所有厨房票据的详细信息。
注意:这些报告仅适用于使用厨房显示系统(KDS)的客户。如果您的厨房使用打印票据,这些报告将没有数据。
本文内容:
厨房运营报告介绍
厨房运营(KDS完成)报告允许您查看从厨师在KDS上接收订单到完成订单的时间,以及在加速员将食品送到桌子或服务员手中时的时间。
请参见下表以获取所有可用的厨房运营报告:
| 报告 | 描述 | 用途 |
|---|---|---|
| 提供在特定小时内完成的票据数量的高层次视图,以及完成这些票据所需的平均时间。 | 这是衡量厨房繁忙程度的一个好指标。 | |
| 分解在设定时间间隔内每个工作站完成的票据数量。 | 有助于提供洞察您厨房在特定时间内如何处理工作负载。测量票据周转时间。 | |
| 深入分析每个厨房票据的详细信息。 | 显示特定票据发生了什么以及何时发生(从厨房的角度)。 |
导航至厨房报告
在 Toast Web 中,导航至 报告.使用屏幕左侧的报告导航,选择厨房运营以打开下拉菜单。
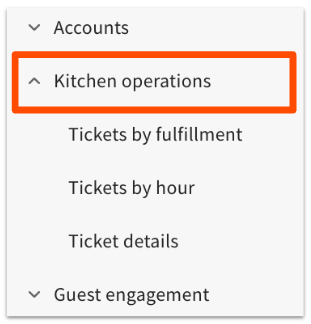
以下厨房显示/完成报告可用:
- 票据(按完成情况)
- 票据(按小时)
- 票据详情
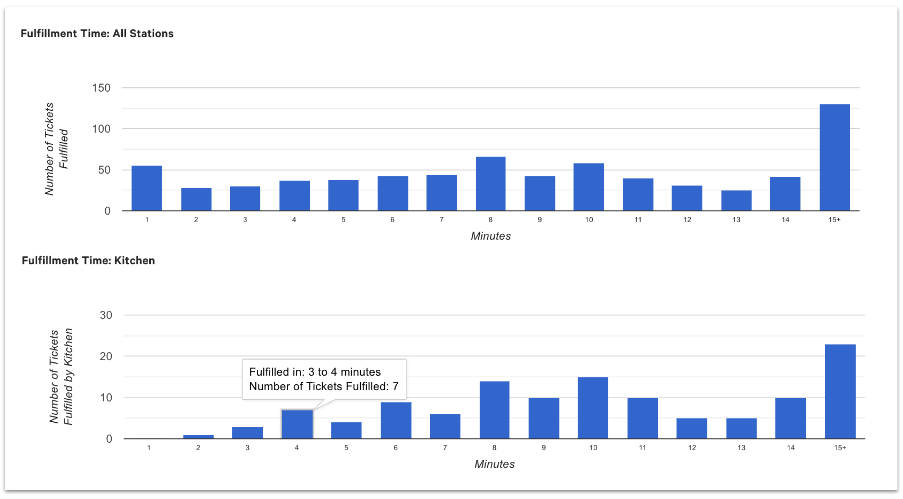
按完成时间的票据报告
此报告详细说明在设定时间间隔内每个站点完成的票据数量。在下面的示例中,您可以看到所有站点在每个时间间隔内的票据数量与厨房站点的完成时间的票据数量的比较。
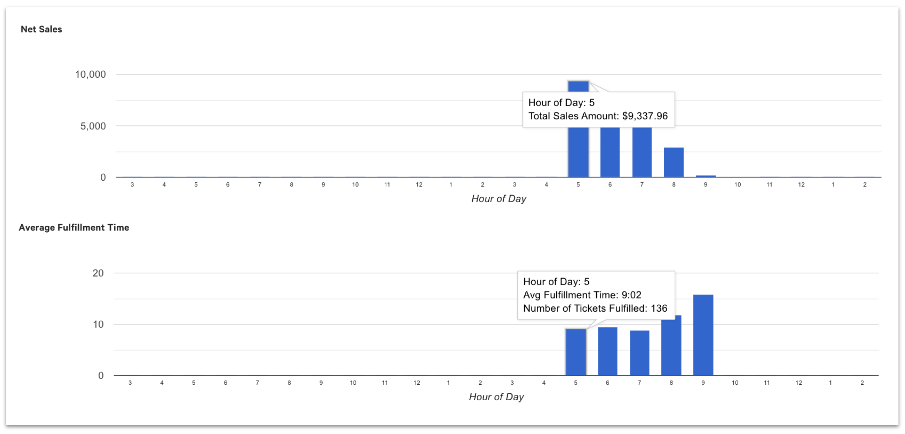
按小时的票据报告
此报告提供以下数据的图表:
- 逐小时的净销售额读数
- 在特定小时内完成的票据数量
- 完成厨房票据所需的平均时间
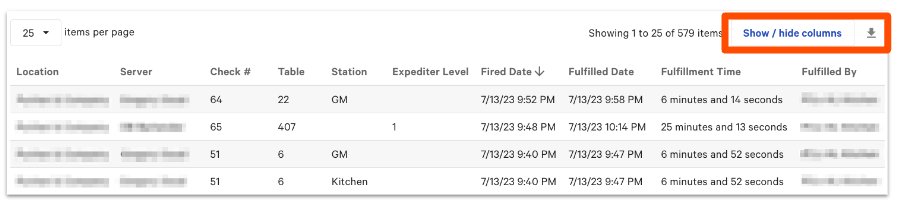
票据详情报告
此报告显示单个厨房票据的更详细信息。您可以通过从显示/隐藏列按钮中选择选项来自定义报告中显示的数据。
此报告可以导出为.csv文件。