Employee Productivity Report
Last updated: Feb 25, 2026, 12:28 PM
The Employee Productivity report can be used to locate and compare specific sales and table trends per employee over a period of time.
- Employee Productivity Report Basics
- Features of the Employee Productivity Report
- Employee Access in Toast Web
- Employee Performance in the MyToast App
Employee Productivity Report Basics
The Employee Productivity report takes into account a selected range of sales data to provide an overview of productivity per each employee. As of October 2025, there is added functionality to this page; employers can gain information about their business, such as total sales, guests served, and employee trends to help you make critical operational decisions. Continue reading to discover each feature of this report and how you can leverage it to increase your business's efficiency.
In Toast Web, navigate to Reports > Labor > Employee productivity to view this report.
Features of the Employee Productivity Report
Filters and Buttons on the Employee Productivity Report
At the top, two drop-down menus should be set each time you view this page. The first drop-down menu is your date selector and the second is your location selector. In addition, you can select the More filters button to add in revenue centers, service areas, dining options, and other options.
Just below the drop-down menus, you can find a quick overview of the popular averages for the timeframe, location(s), and any potential filters you chose. This quick overview (and the rest of the page) will dynamically update as you change your date, location, or filter selections. These numbers also live at the bottom of the table below.
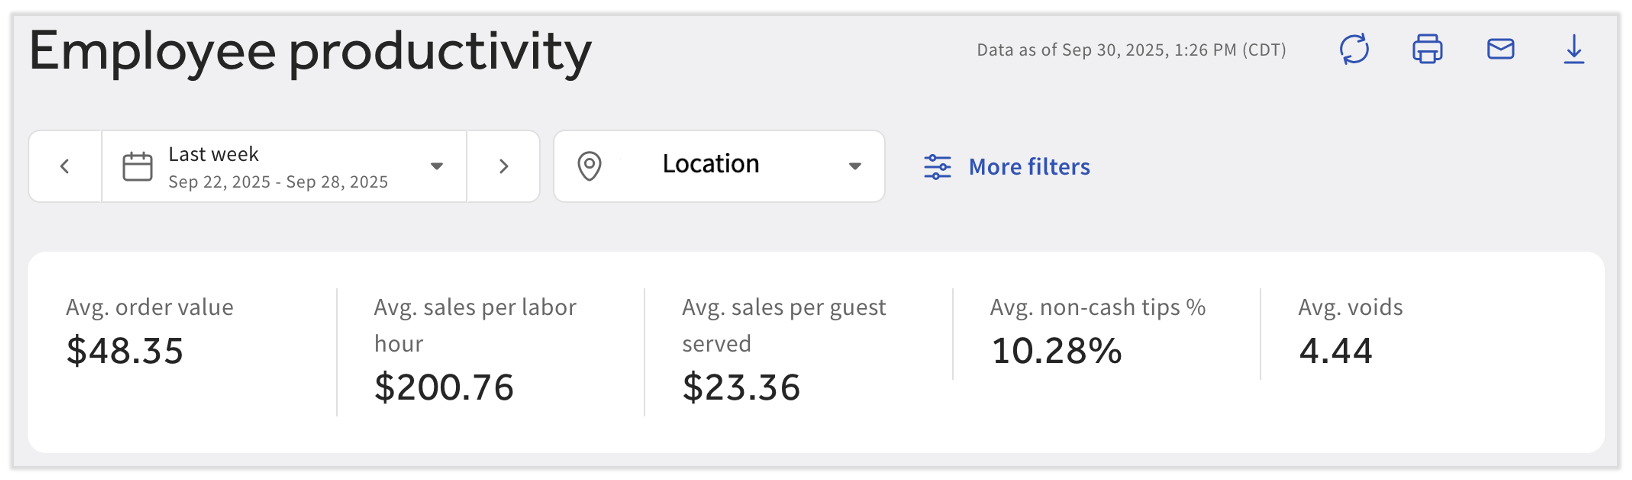
In the upper right corner, you can select from the four icons for different processes:
- Refresh: Select the arrows in a circle when you're looking at a time frame that isn't closed yet (e.g. today, this week, or this month) to see the most up-to-date information.
- Print: Select the printer icon to open your device's printing workflow and print your displayed date.
- Email: Select Email CSV file or Email Excel file to receive an email of the filtered data sent to the email address you signed in with.
- Download: Select Download CSV file or Download Excel file to queue Toast to download the data on your page onto your device. This action will download a .zip file containing all three of the available options in the Sales Performance tab.
Sales Performance on the Employee Productivity Report
Further down the Employee Productivity Report, users will see the Sales performance tab. Sales performance is a breakdown of all the data per employee based on the date(s), location(s), and any other potential filters you may have set. The drop-down menu just below this tab title allows you to select between three ways of viewing this information: Overall, Per hour worked, or Per guest served.
- Overall: This is the default view that allows you to compare totals over your entire timeframe set at the top of the page.
- Per hour worked: As stated, this view further breaks down the data per hour, allowing a closer look at how each employee performs.
- If a user does not see this filter, it is because they do not have permission 4.3 Labor Reports. This feature ensures restaurant-wide labor data is only visible to those who should have access to it.
- Per guest served: In order to compare employees who may have worked more hours or during different shifts than other employees, use this popular filter to easily standardize and compare the number of orders per guest or sales per guest columns for a more accurate look.
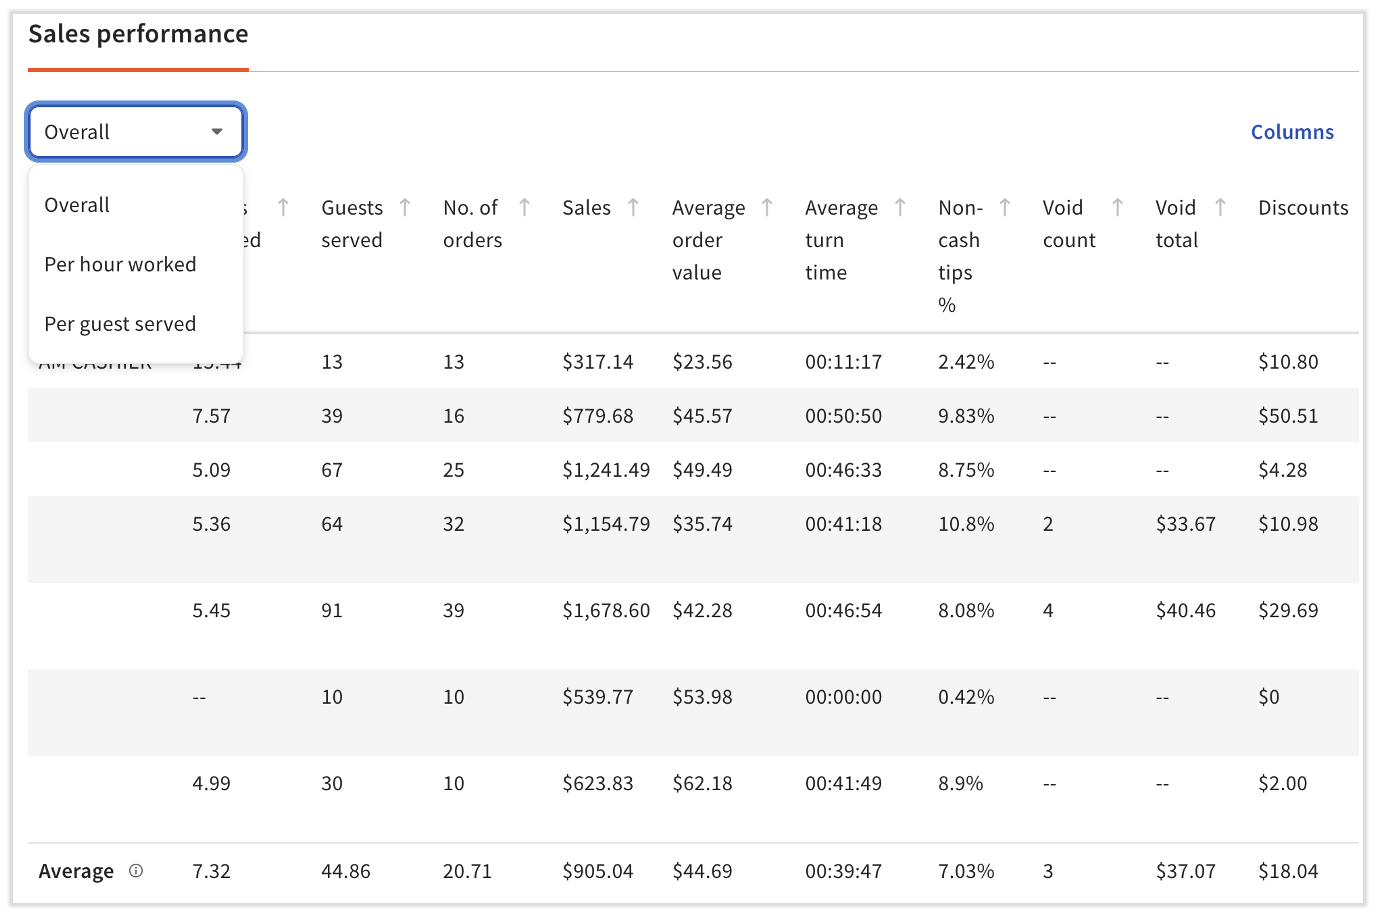
You can also select the Columns button in the upper-right corner of this table to add/remove any data points. By default, all columns are enabled on the table.
Note: If you see negative turn times or other issues with this report, they could be caused by orders taken in offline mode, system errors, an issue with clock-in or clock-out times, or an incorrect entry in the system. To identify the cause, investigate specific checks that occurred during the employee's shift and any unusual events or errors reported in the system at the time the negative turn time was recorded. This can be done by navigating to Reports > Sales > Orders and setting filters for the appropriate day(s) and employee(s), then selecting Update.
Employee Trends Graph on the Employee Productivity Report
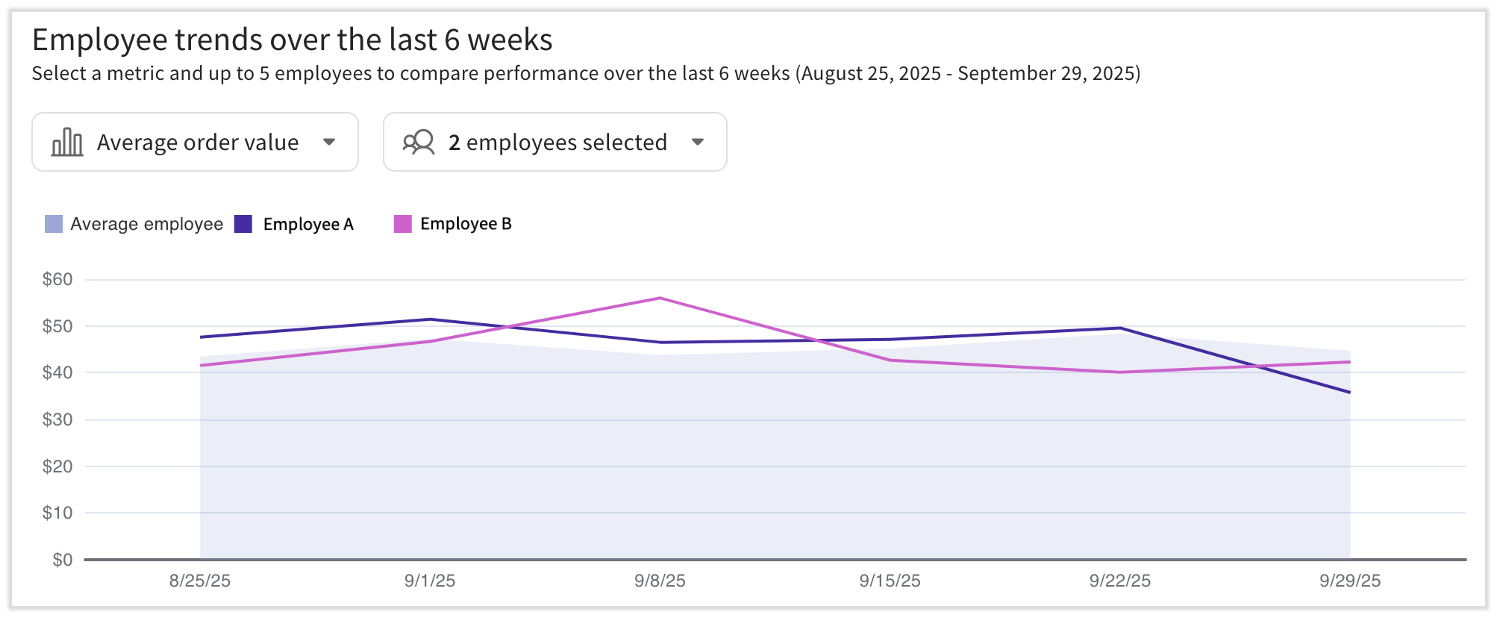
Below the table is a trends graph that lets you see data over the past six weeks and easily locate inconsistencies or outliers. The best part is you can select from 11 different metrics (10 if you do not have permission 4.3 Labor Reports; Sales/hour will be hidden). At this time, the date range of this graph cannot be changed.
The shaded area in this graph will always refer to the average of all employees. The line(s) indicate each employee by color and you can add up to 5 employees at once on this graph.
Pro tip: If you're looking for something specific with an employee or a group of employees, add them here and then switch between the different metrics to find data to support or deny your ideas. Some questions it could help you to answer are:
- Sales/hour or Average order value: What individuals should I schedule together to improve their performance?
- Average turn time: What shifts should I increase my staffing to improve how quickly the customers are served?
If you have any suggestions, comments, or other feedback regarding the Employee Productivity report, scroll to the bottom of the page and select Leave feedback.
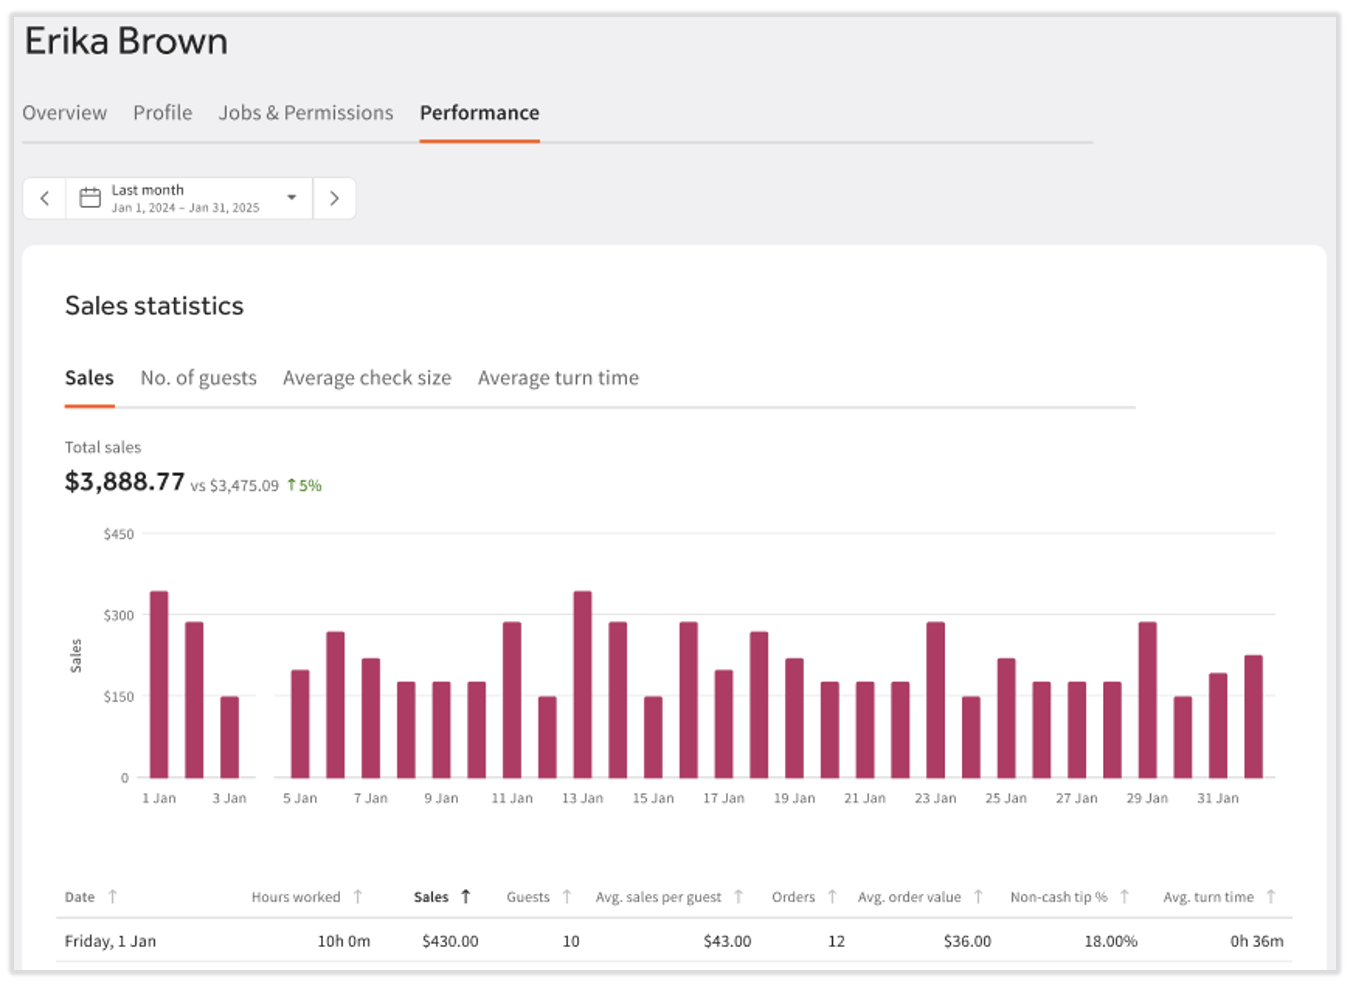
Employee Access in Toast Web
The sales and labor performance data for an individual employee is also available on the employee's profile in Toast Web. This is visible to users who have permissions 4.9 Employee Info and 4.10 Employee Jobs and Wages (for employee profile access) and permission 4.3 Labor Reports (since this is labor data).
Employee Performance in the MyToast App
Employee performance or labor data is visible in the MyToast app on the Today tab. The user's Toast Web profile must have permissions 4.9 Employee Info, 4.10 Employee Jobs and Wages, and 4.3 Labor Reports to see this data.