Toast Reporting Dashboard: Weekly Overview
Last updated: Jun 11, 2026, 11:45 AM
- Open the Weekly Overview dashboard
- Choose the time period and comparison
- Key Metrics section
- Net Sales data
- Labor Cost data
- Guest Count data
- Top Selling Items data
- Frequently asked questions
- Related Articles
The Toast reporting dashboard gives you a single weekly view of your restaurant's performance across four key areas: sales, labor, guest counts, and menu performance. This article explains how to open the Weekly Overview, change the time period and comparison, and read each section of the dashboard.
Open the Weekly Overview dashboard
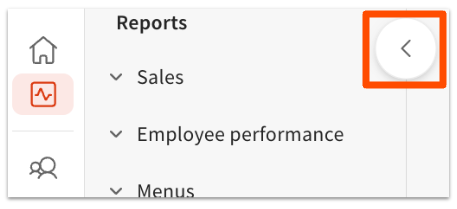
To open the Weekly Overview in Toast Web, select Reports on the navigation bar on the left-hand side of your screen. The dashboard opens to the Weekly Overview by default.
To access other reports, select the > icon at the top-left of the page to expand the reports navigation.
The dashboard displays data in a weekly cadence and refreshes hourly.
Note: If you don't see Reports in your navigation, your user permissions may not include reporting access. See Why can't I access a report in Toast Web? for how to check and request access.
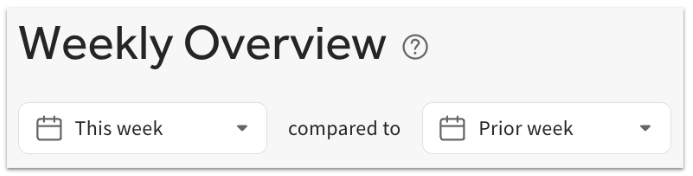
Choose the time period and comparison
At the top of the dashboard, use the filter drop-down to select either This week or Last week.
You can also compare performance against an earlier period. The dashboard can compare the selected week to the prior week, the same week last year, or the same week 2 years ago. Each section then displays the percent change versus the comparison period you choose.
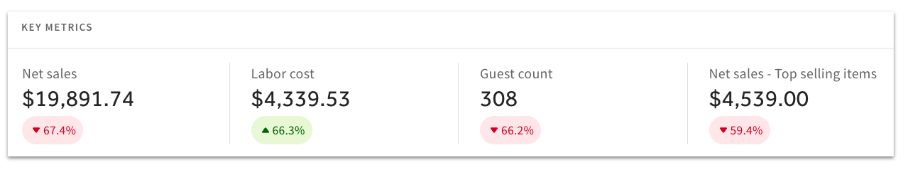
Key Metrics section
The Key Metrics section at the top of the page summarizes the four areas tracked on the dashboard: Net Sales, Labor Cost, Guest Count, and Net Sales for Top Selling Items. Depending on the selection at the top of the page, Key Metrics displays either week-to-date totals or full-week totals for each metric.
Net Sales data
The Net Sales section displays total net sales — either week-to-date or for the previous week — along with the percent change compared to the period you selected. Today's date is highlighted in grey.
Select any net sales value to open the Sales report for a detailed comparison between time periods.
Note: Net sales on this dashboard may not match other Toast reports that handle refunds, fees, or unpaid orders differently. To understand why two reports show different sales totals for the same period, see Reporting Best Practices: Weekly, Monthly, Quarterly & Yearly.
Labor Cost data
The Labor Cost section displays total labor cost as a dollar amount and as a cost percentage of sales — either week-to-date or for the previous week — along with the percent change compared to the period you selected.
Select any labor cost value to open the Labor Summary report for more detail.
Guest Count data
The Guest Count section displays the total number of guests served — either week-to-date or for the previous week — along with the percent change compared to the period you selected.
Select the Customers on orders value to open the Guest Information report for more detail.
Note: There is no report that shows weekly guest counts across an entire year.
Top Selling Items data
The Top Selling Items section displays the seven highest-selling items, either week-to-date or for the previous week. For each item, it shows the item name, the quantity sold per day, the net sales for that item, and the percent change in net sales compared to the period you selected.
Select the net sales value to open the Menu Breakdown report for more detail.
Frequently asked questions
How often does the Weekly Overview dashboard refresh?
The Weekly Overview dashboard refreshes hourly and displays data in a weekly cadence. If a recent sale or shift isn't showing yet, wait for the next hourly refresh.
Can I compare this week to last year on the dashboard?
Yes, you can compare this week to last year on the dashboard. Use the comparison drop-down at the top of the page to compare the selected week to the prior week, the same week last year, or the same week 2 years ago. Each section then shows the percent change against the comparison period.
Why don't the net sales on the dashboard match another Toast report?
Net sales on the dashboard can differ from another Toast report because reports handle refunds, fees, service charges, and unpaid orders differently, and some apply refunds on the original sale date while others apply them on the refund date. To see the common causes and which report to treat as the source of truth, see Reporting Best Practices: Weekly, Monthly, Quarterly & Yearly.
Can I see weekly guest counts for a full year?
No, you cannot see weekly guest counts for a full year on this dashboard. There is no report that shows weekly guest counts across an entire year. For guest detail within a period, select the Customers on orders value to open the Guest Information report.
How do I open the detailed report behind a dashboard number?
To open the detailed report behind a dashboard number, select the value you want to investigate. Net sales values open the Sales report, labor cost values open the Labor Summary report, the Customers on orders value opens the Guest Information report, and Top Selling Items net sales values open the Menu Breakdown report.
Related Articles
- Reporting Best Practices: Weekly, Monthly, Quarterly & Yearly
- Sales Reports Overview
- Labor Reports Overview
- Location Reports Overview
- Why can't I access a report in Toast Web?