Toast Benchmarking Overview
Last updated: Mar 25, 2026, 1:53 PM
- Toast Benchmarking Overview
- Filter Your Benchmarking Reports
- Restaurant Overview
- Menu Insights
- Service Performance
- Additional Resources
Toast Benchmarking is provided for informational purposes only, and insights are not to be construed as recommendations or professional advice of any kind. Toast does not warrant the accuracy or completeness of any information, text, graphics, links, or other items contained in Toast Benchmarking.
Toast Benchmarking Overview
Toast Benchmarking is built to conquer complex operations with features that work better together (learn more: Toast Suites Overview). Benchmarking data leverages aggregated metrics across Toast merchants to help give you insights on how your business is performing.
- Compare data with peers - See how your sales and operational metrics stack up to peers in your region for a specific time period or a specific day. See trends across geography and concept type for even broader insights.
- Filter and sort for detailed analysis - Analyze sales by menu category to understand performance by menu item or beverage type.
- Slice and dice your data - See sales across all your channels or focus in on one. Break data down by order channel to see how the way you reach guests compares.
To access the Benchmarking reports, navigate to the Reports page in Toast Web and open the Benchmarking drop-down. You will need the 4.20 Benchmarking Access permission in order to see the data on this report.
The Toast Benchmarking reports include:
- Group overview (for Restaurant Management suite)
- Benchmarking
- Service performance
Note: You can opt out of having data from your restaurant included in the Toast Benchmarking feature by emailing benchmarking@toasttab.com. Opt-out requests take approximately 30 days to process. By opting out, you will lose access to Toast Benchmarking. Learn more about how aggregated data is leveraged with Toast Benchmarking in this Support Center article: Toast Benchmarking FAQ.
Toast Benchmarking Reporting Features
Benchmarking Lite is available to all Toast customers who have the POS & Restaurant Operations suite, and offers basic functionality for comparing performance within a geographic area over a specific time period.
The Restaurant Management suite delivers a more comprehensive set of features with Benchmarking Essentials, including longer-term comparisons, detailed performance insights, and broader analytical capabilities
| Feature | Benchmarking Lite | Benchmarking Essentials |
| Reporting time period | Compare sales and operational metrics with peers within your geographic area over a 30-day period. | Compare sales and operational metrics with peers across any time period, including comprehensive year-over-year comparisons. |
| Sales insights | View and analyze sales across all channels or specific ones, with a breakdown by order channel. Toggle between sales, item count, and effective pricing data. | View and analyze sales across all channels or specific ones, with detailed breakdowns by order channel. Toggle between sales, item count, and effective pricing data. |
| Year-over-year comparison | Limited capability | Available for various time periods and at restaurant, regional, state, and national levels. |
| Service performance | Not available | Includes charts showing average table turn times and hourly sales performance against peers. |
| Menu insights | Item-level menu insights are not available. | Provides detailed analysis of sales by menu category and item-level insights. Review how menu items are tagged and make adjustments if desired. |
| Peer group selection | Limited to location and service selection. | Can select peer group based on location (including by ZIP Code), service, cuisine/type, price range, and their alcohol sales
|
| Group overview | Not Available | See Toast Benchmarking: Multi-Unit Group Overview for more information. |
Filter Your Benchmarking Reports
At the top of any of the Benchmarking reports, you’ll see your comparison group filter, which allows you to select which type of restaurants you’d like to compare to.
Your filter selections will apply to all of the Benchmarking reports, and you can make changes at any time by reopening the filter and selecting Edit peer group.
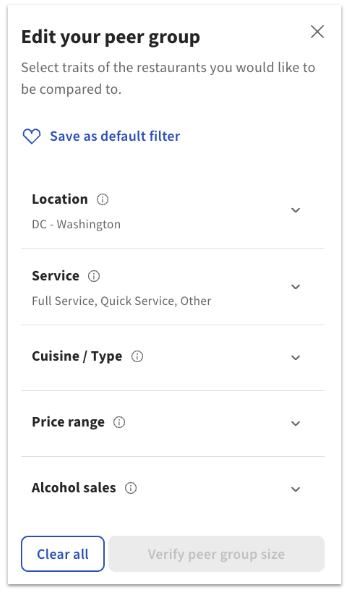
Select the traits of the restaurants you would like to be compared to:
- Location: Select the state and the city/cities where your peer group operates. You can choose multiple cities within a state, or if you have Benchmarking Essentials you can select specific ZIP Codes or even switch to another state to refine your peer group.
- Service: Select the service model of your peer group: Full Service, Quick Service, or Other.
- Full-service restaurant (FSR): Casual dining, fine dining, pizzeria, other (may include hotels, restaurants with adjoining retail, special venues, etc.)
- Quick-service restaurant (QSR): Fast casual, cafe/bakery, pizzeria, other (may include food trucks, stadiums, concession stands, etc.)
- Other: May include ghost kitchens, event venues, retail, institutions, etc.
- Cuisine/Type: Select the cuisine (e.g., American, Mexican) and type (e.g., Seafood, Burgers) that best match your peer group. Restaurants in the peer group will have a significant portion of their menu or sales mix aligned with these labels, determined by Toast’s machine learning models.
- Price range: Select a price range ($–$$$$) based on average ticket size over the last six months. These ranges are calculated after removing extreme values and represent approximate averages (as shown in parentheses), though they may vary slightly.
- Alcohol sales: Select a range for alcohol sales percentage based on the last six months of sales data. These ranges are approximate and help you find peer groups with a similar product mix—whether they primarily sell food or a higher proportion of alcohol.
Select Verify peer group size to save your parameters. Benchmarking insights are available only when there are enough restaurants in the comparison group selected. If there isn’t enough data for your selected city or state, we will provide a list of suggested cities to expand your data set.
If you’d like to keep your selection for the next time you view your Benchmarking reports, you can also select Save as default filter.
Note: The model that is used to categorize restaurants leverages an AI-based classification tool to help assign restaurant categories. Please note that while we aim to continuously improve this model, insights are provided for general informational purposes only and may be incomplete or inaccurate.
Benchmarking Report: Restaurant Overview
The Restaurant overview tab will show you how you compare to other restaurants in your selected peer group.
The Overview Stats cards show a summarized data comparison for Net sales, Sales per labor hour, Total orders, and Average check size.
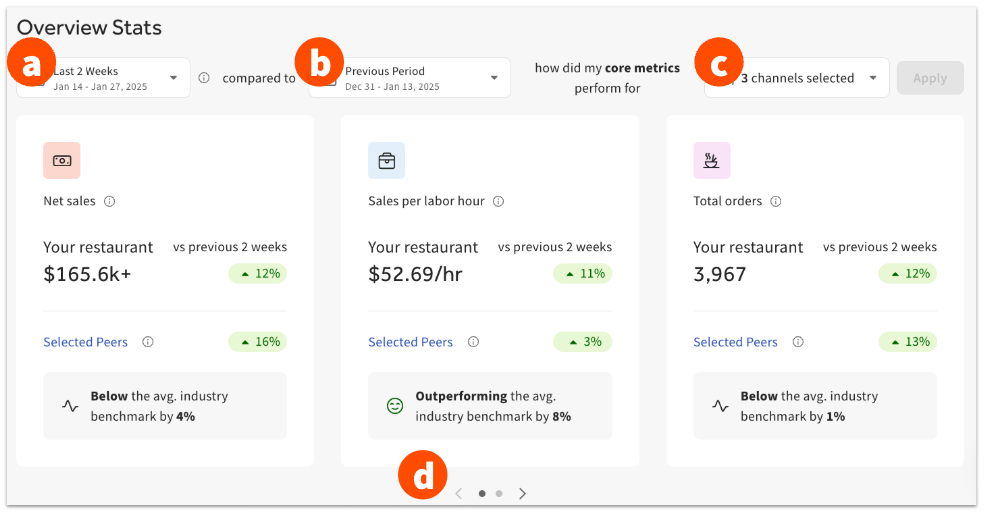
- Above the charts, use the date drop-down to select your desired time period (last week, last 2 weeks, last 4 weeks, last 12 weeks).
- The second drop-down allows you to decide if you want to compare your data against the Previous period (same amount of time, right before your selected time frame) or Previous Year (same amount of time, one year ago).
- Finally, you can select which order channels you’d like your core metrics to include: On premise, First party online, Third party online, or a combination of those options.
- Use the arrow icons to view all available comparisons.
Benchmarking Report: Performance Over Time
The Performance Over Time section of the Benchmarking Restaurant overview shows a highly customizable chart with detailed data for your location compared to your selected peer group.
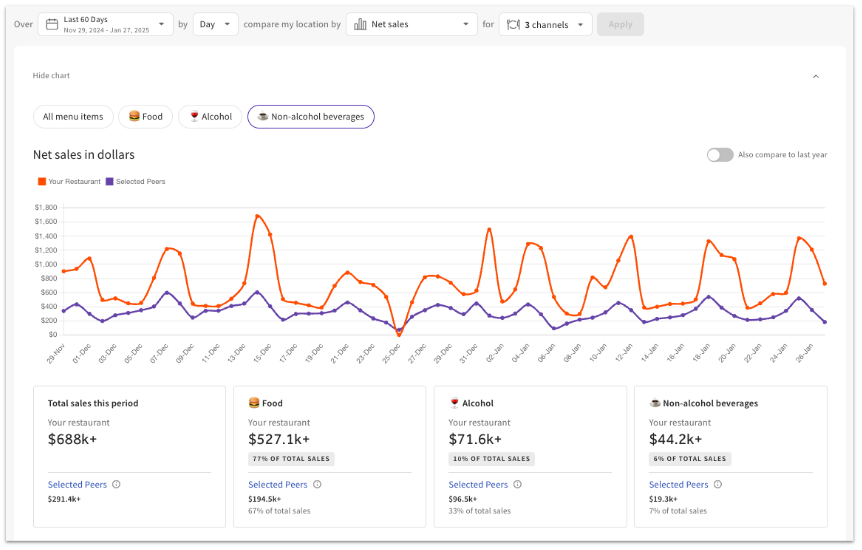
- Select your desired time period and time interval. For example, you can look at a week-by-week comparison of the last 30 days.
- For selected ranges over 180 days, you can view data by month only.
- Choose which data you’d like to review: Net sales, Order volume, Menu items sold, Sales per labor hour, or Average check size.
- Select the desired ordering channels you’d like to include.
- Once you select Apply, the chart will update to display your chosen data.
At the top of the chart are toggles which allow you to view All menu items, Food only, Alcohol only, or Non-alcohol beverages only.
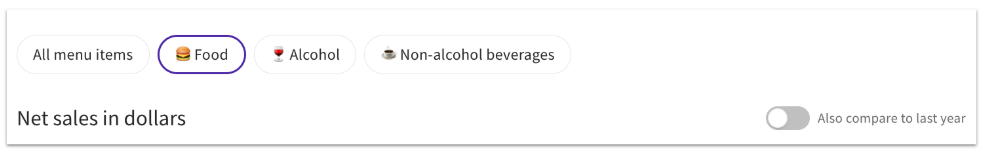
You can toggle Also compare to last year to the on position to add data from the previous year to the chart.
Hover over any data point to see more details:
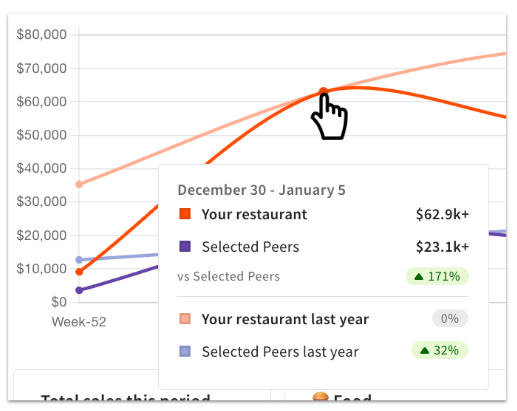
Below the chart you’ll see summary cards for total sales, food sales, alcohol sales, and non-alcohol beverage slaes for your business and your selected peers for the chosen time period.
Benchmarking Report: Effective Pricing Benchmarking
The Effective Pricing Benchmarking section of the Benchmarking Restaurant overview shows you how your top sellers measure up to your selected peers in the previous month. This can include:
- Your restaurant’s average item cost for food, alcohol, and non-alcohol beverages.
- Effective price is calculated based on total sales of the category divided by the number of items sold.
- Your top sellers in each category, your restaurant’s price, and your selected peers’ price for similar items.
You can select View full item performance to visit the Menu insights tab for more detailed information.
Benchmarking Report: Menu Insights
The Menu insights tab provides data about how your menu item categories compare to the average restaurant in the filters you selected. Item-level menu insights are exclusive to users of Toast Benchmarking Essentials.
- Select your desired date range and ordering channels at the top of the page, then select Apply.
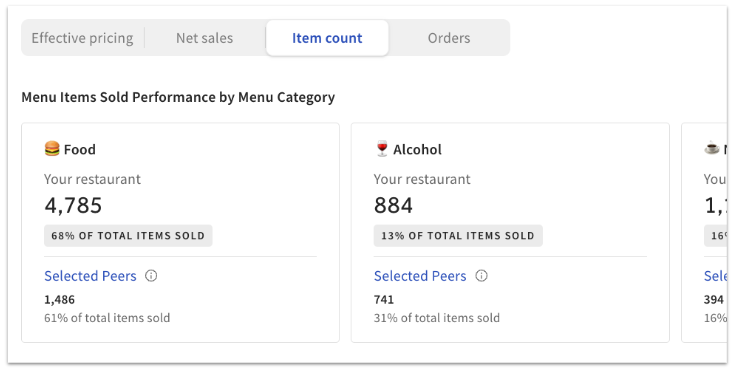
- Above the chart, you’ll see a toggle to switch between data on Effective pricing, Net sales, Item count, and Orders.
- Note: Effective pricing is not based on your actual menu prices, but is calculated based on the total sales of that category divided by the number of category items sold. This means, for example, if you had specials or discounts, the effective price will be lower than your menu price.
- The cards at the top of this tab will show your restaurant’s performance by menu category:
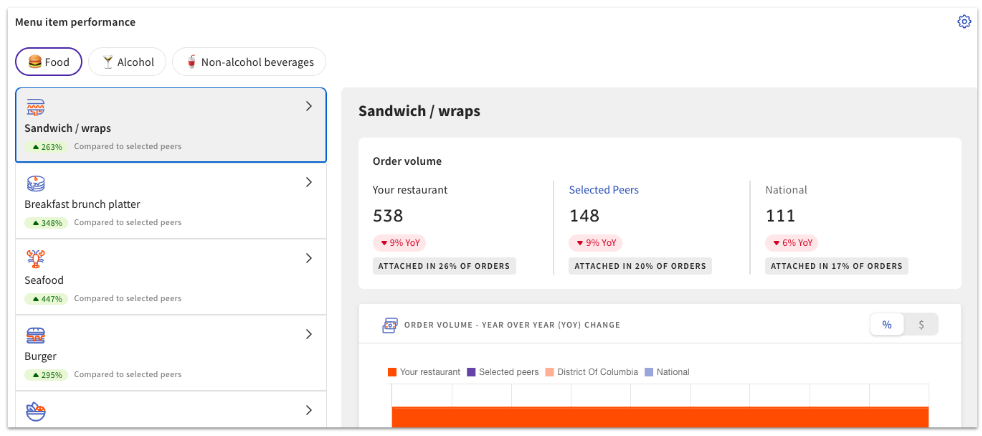
- Below that, you’ll see an interactive Menu item performance table. Select a menu item category on the left side of the screen to update the data on the right side. In the example below, you’ll see order volume data for the Sandwich/wraps category, including
- Data for your restaurant, for the selected time period
- Data for your selected peer group
- National data
- A year-over-year (YOY) comparison
- Select the settings icon at the top of the Menu item performance section to set your preferences for which categories to display on this report. You can make changes to these preferences at any time.
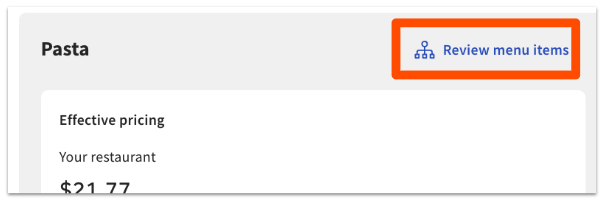
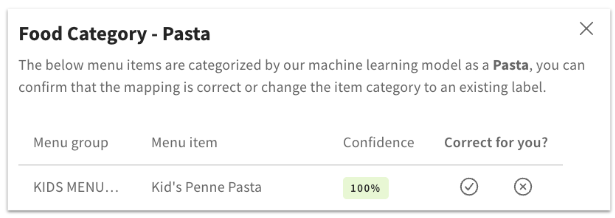
- Note: Toast uses an AI-based classification tool to categorize menu items. Some menu item categorizations may be incomplete or inaccurate, and we are continuously working to improve the accuracy. You will only see insights for menu categories that you offer at your location (so for example, if your restaurant is a steakhouse, you will not have access to insights for “sushi rolls” unless they are also on your menu). If you'd like to review these menu item labels, you can select Review menu items at the top of the menu item performance chart:
- This will show you a list of menu items for the given food category, a confidence rating for the label, and the ability to select whether this label is correct for your business. If you indicate that a menu item is labeled incorrectly, a drop-down will appear to allow you to adjust how that item is categorized. Changes take up to 48 hours to process for Benchmarking reports.
- Note: Toast uses an AI-based classification tool to categorize menu items. Some menu item categorizations may be incomplete or inaccurate, and we are continuously working to improve the accuracy. You will only see insights for menu categories that you offer at your location (so for example, if your restaurant is a steakhouse, you will not have access to insights for “sushi rolls” unless they are also on your menu). If you'd like to review these menu item labels, you can select Review menu items at the top of the menu item performance chart:
Benchmarking Report: Service Performance
The Service performance report can help you understand how your sales and speed of service compare to other Toast restaurants.
At the top, you’ll see data for Average hourly sales and Average table turnover for your restaurant and your selected peer group. The date range for this report is filtered to the last 7 days and cannot be changed. You’ll also see how your data compares to the average industry benchmark.
Next is the Hourly Trends table. The date range for this chart is the last 35 days (five weeks) and cannot be changed. Choose to view Net sales, Order volume, Menu items sold, or Average check size, and select your desired ordering channels. Use the toggle on the top right corner of the chart to view hourly trends for different days of the week.
This report also contains a Tables Turnover Performance chart, which is also set to the last 35 days (five weeks). This will show your average table turnover time in minutes, every hour, compared to your selected peer group.