Toast Inventory: Inventory Variance Reports (Canada, Ireland, and UK)
Last updated: Apr 22, 2026, 6:32 PM
This article looks at Toast's Inventory Variance Report which compares theoretical vs. actual stock to track waste, identify shortages, and control restaurant costs.
| This feature is currently in a Beta testing release in Canada, Ireland, and the UK. |
- Inventory Variance Report Introduction
- Accessing the Report
- Understanding the Inventory Variance Report
- Top Variance Issues
- Inventory Variance Report Detailed Data Breakdown
- How These Numbers are Calculated
- The Variance Formula
- Leverage Actual vs Theoretical Analysis
- Export the Inventory Variance Report
- Additional Resources
Inventory Variance Report Introduction
Inventory variance report in Toast Inventory allows you to track and compare your actual and theoretical inventory consumption, monitor inventory depletion, identify waste, and control your restaurant costs for maximum profitability. It is useful to track AvT use because you can keep a close watch on what inventory is going unaccounted for and adjust accordingly.
Accessing the Inventory Variance Report
To generate a variance report, you should have first completed a physical stock count on at least two different dates. To learn more about how to complete a stock check, see the article Get Started with Toast Inventory (Canada, Ireland, and UK).
To view Inventory variance report:
- Log in to Toast Web and navigate to Inventory > Inventory variance.
- Select a start and ending inventory date.
- Only dates where a stock check has been submitted are available for selection.
- Your opening inventory is taken from the submitted inventory values of the From date.
- Your closing inventory is taken from the submitted inventory values To date.
- When selecting a start and end date, you can hover your mouse over a specific date to see a pop-up list of all storage areas that were counted on that day. This sets the parameters for your chosen report.
Note: For best results in this report, choose start and end dates where you have counted the same storage areas.
Understanding the Inventory Variance Report
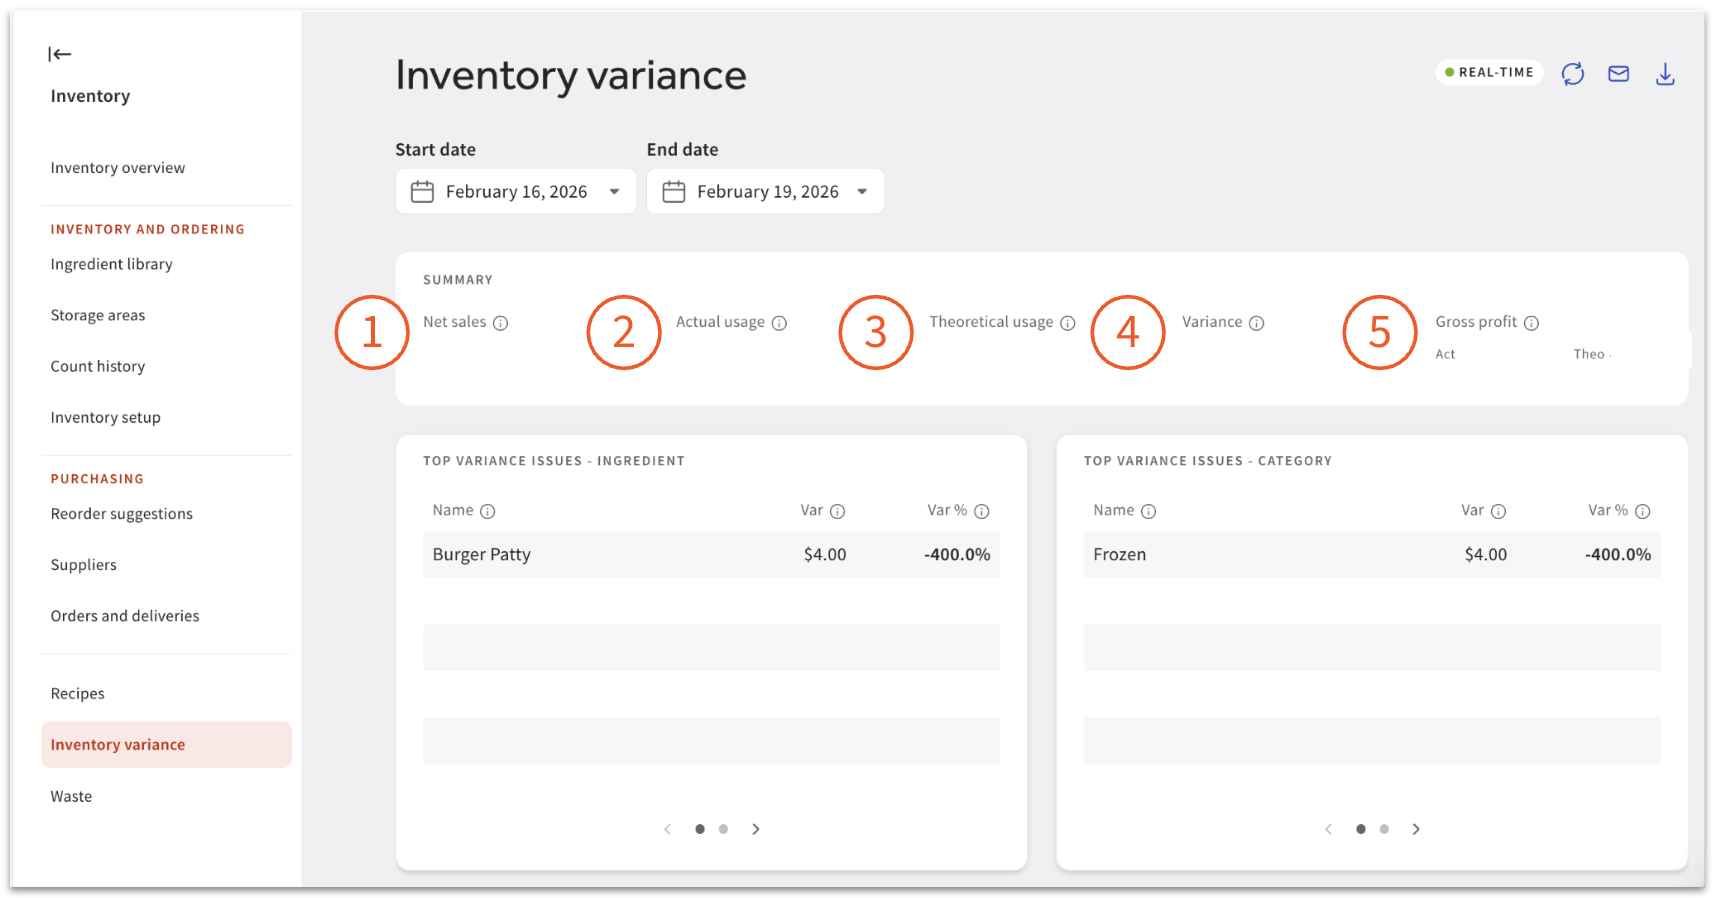
Summary Overview
The top section of the report provides an overview for the selected period:
- Net Sales: The Total Sales revenue for the selected period.
- Actual Usage: The actual cost of inventory used based on stock activity
- Theoretical Usage: The expected cost of inventory used based on sales
- Variance: The difference between Actual Usage and Theoretical Usage.
- Note: Ideally, the variance should be zero.
- Gross Profit: Shows the difference between Actual Usage/Theoretical Usage and Net Sales. This helps calculate profit margins for the period.
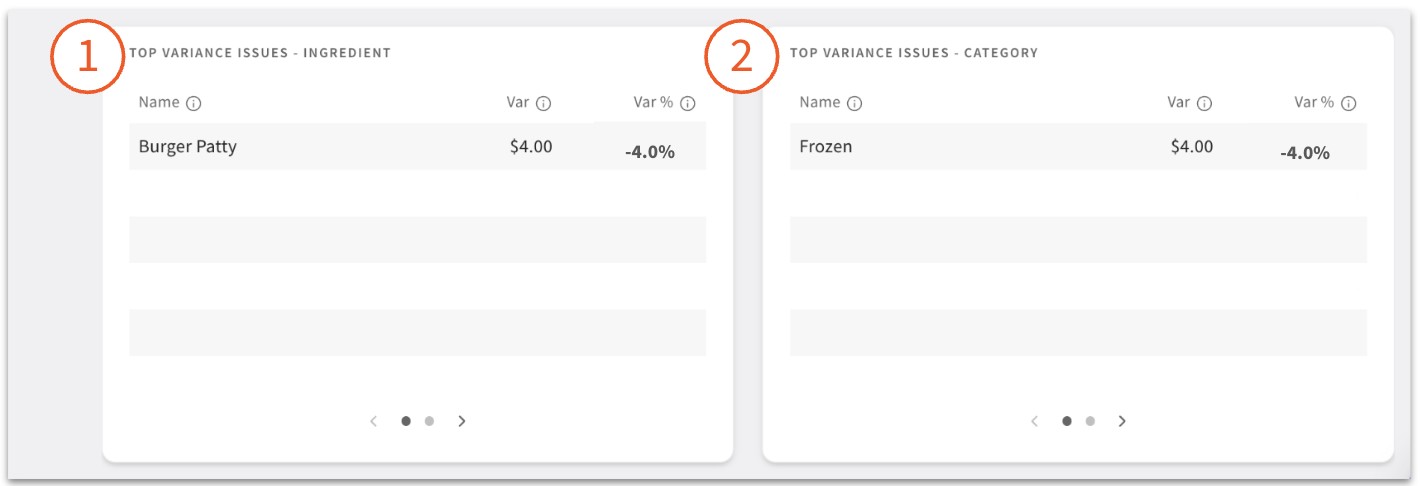
Top Variance Issues
This section highlights problem areas by identifying the top 10 ingredients or categories showing variance, ordered by percentage.
- Ingredient: A negative variance (e.g., more burger patties used than expected) indicates a problem requiring investigation.
- Category: Identifies categories with the highest variance to spot systemic issues.
Inventory Variance Report Detailed Data Breakdown
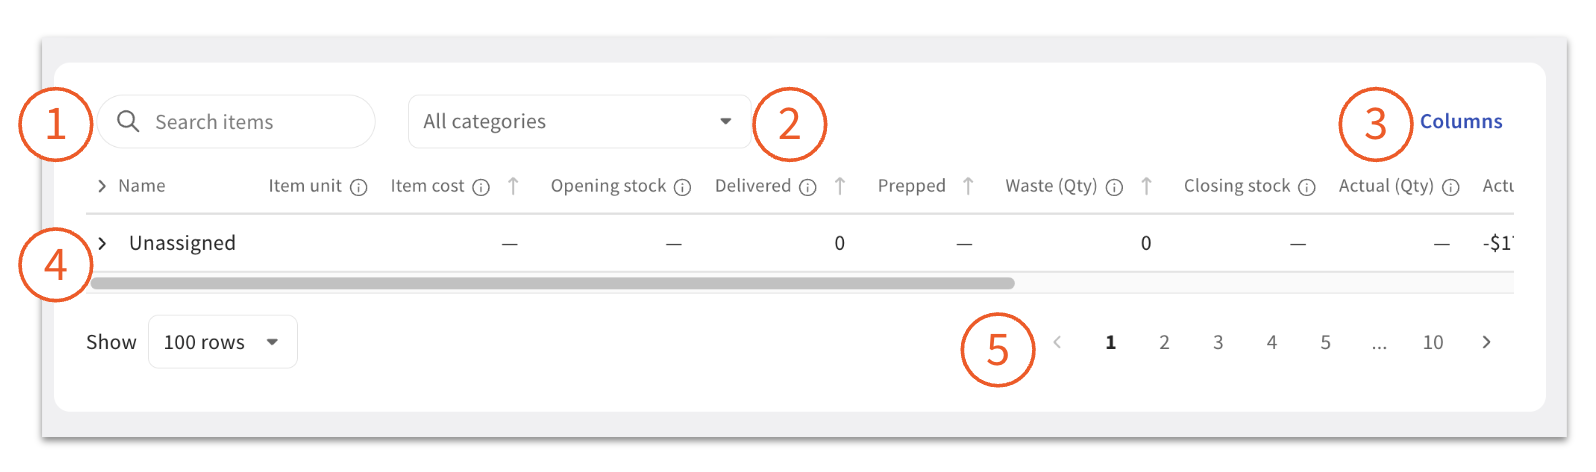
This table is the core of the report, containing comprehensive data for all ingredients in the library. Above the report, you’ll see search and category filters.
- You can select the Search items option to choose a specific ingredient range for your report.
- Use the drop-down menu to filter the report by category to view specific groups.
- Customise your view using the Columns feature. Selecting Reset returns columns to the standard configuration. Any changes made to columns on the report will reflect on downloaded or exported report data.
- Select the chevron ( > ) next to a category name to expand it and view the individual ingredient rows for detailed stock usage and variance breakdowns.
- For large reports, a pagination and view control section enables you to change the number of items shown per page and easily navigate through the report.
Note: We recommend showing 100 rows per page for the best view of the report.
Inventory Variance Report Breakdown
Data Columns (for a counted ingredient):
| Column Name | Definition |
| Name | Ingredient name
Note: Selecting the hyperlinked ingredient name opens a log of all activities, including sales, stock checks, waste entries, and counts. |
| Item unit | Current item primary Unit of Measure |
| Item Cost | Current cost for 1 unit |
| Opening Stock | Item count on opening date |
| Delivered | Stock received between opening and closing counts |
| Prepped | Quantity of the ingredient that has been used in batches |
| Waste (Qty) | Stock logged as wasted between opening and closing counts |
| Closing stock | Item count on closing date
Note: A warning icon and message “Metric could not be calculated” will appear if there is a missing starting or ending count for the item. |
| Actual (Qty) | Calculation: Opening count + Delivered - Prepped - Waste - Closing count |
| Actual (Value) | Value of actual stock usage |
| Theo (Qty) | Estimated stock use from sales of Menu items with Recipes + Waste |
| Var (Qty) | Actual usage - Theoretical usage (stock units) |
| Var (Value) | Actual usage value - Theoretical usage value |
| Var % | Actual usage - Theoretical usage (%) |
How These Numbers are Calculated in the Inventory Variance Report
Theoretical Consumption
Theoretical consumption is solely based on your menu item sales and their corresponding recipes. You can connect Recipes to Toast menu items when creating or editing recipes.
- The Formula: Ingredient amount used in a recipe x number of menu items sold.
- Example: If you use one avocado ($/£/€1) for Avocado Toast and sell 100 orders, your theoretical consumption is 100 avocados ($/£/€100).
- Troubleshooting: If this looks incorrect, check your Recipe configurations, Units of Measure, and Prep Recipes. To learn more see the article Toast Inventory: Get Started With Recipes (Canada, Ireland, and UK).
Actual Consumption
Actual Consumption is based on events where you've declared your inventory levels have changed, for example, counts, deliveries, waste and batch production.
- The Formula: Opening count + Delivered - Prepped - Waste - Closing count
- Example: You start with 50 avocados on January 1st, purchase 100 more on January 5th, use 20 to prep a batch of guacamole, and log 5 as waste, your actual consumption is 65 avocados based on a final physical count of 60 remaining on January 7th.
- Troubleshooting: To review your Count History in Toast Web, navigate to Inventory > Inventory and ordering > Count History to edit any errors in completed stock checks.
For more information on deliveries, waste and batch production, see the Additional Resources section where you will find further support articles.
The Variance Formula
The difference between your actual and theoretical is termed variance. Variance usually occurs whenever there is a waste of resources, inaccurate portions of meals/drinks, theft, unrecorded sales entries, or errors in stock take.
Variance = actual usage - theoretical usage
- In the avocado example above, your actual consumption is 90 avocados and your theoretical consumption is 100 avocados, so your variance is 10.
Leverage Actual vs Theoretical Analysis
Using your Actual vs Theoretical analysis allows you to identify operational issues in your business, and look for areas where you could better control your costs.
- High Variance: Indicates a significant gap between expected and actual stock usage.
- Slight Variance: Indicates your theoretical food costs are close to "spot on."
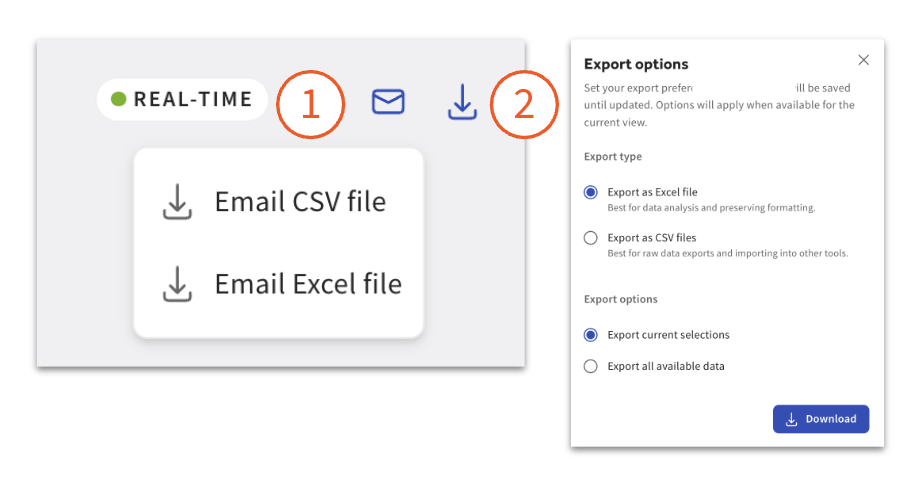
Export the Inventory Variance Report
You can export the Inventory variance report via email or download the data as a CSV (Comma-separated value) or XLS (Microsoft Excel Spreadsheet) file. Select either the email icon or the download icon (down arrow) in the top right corner of the report, and choose your desired file type.
Export options buttons in Inventory variance Report
Additional Resources
- Get Started with Toast Inventory (Canada, Ireland, and UK)
- Toast Inventory: Generate Purchase Orders & Receive Inventory (Canada, Ireland, and UK)
- Get Started With Recipes (Canada, Ireland, and UK)
- Toast Inventory: Log Prep Item Production (Canada, Ireland, and UK)
- Toast Inventory: Stock Depletion (Canada, Ireland, and UK)
- Toast Inventory: Tracking and Managing Waste (Canada, Ireland, and UK)