xtraCHEF: Get Started With Budget Reporting
Last updated: Apr 28, 2026, 4:19 PM
Budget Overview
With xtraCHEF's Budget feature, you can set a projected sales and spending amount and track your real sales and purchases within a specified timeframe. The result is a declining budget that shows you exactly where you are during the course of your fiscal period informing you where adjustments may be needed.
This 7-minute video tutorial walks through your Budget report in xtraCHEF.
Prerequisites
Before you can begin using the Budget tool, you'll first need to ensure you have completed a few vital configuration steps. Use this checklist to make sure you have everything in place before continuing with budget setup:
- Complete cost of goods sold (COGS) mapping.
- Configure your accounting period.
- Upload or continue uploading invoices and receipts to xtraCHEF. The budget tool will require at least one month of consistent uploads in order to report on your business spending.
- Have integrated xtraCHEF with your Toast POS and completed sales setup.
- Gather your existing monthly sales data and create an estimate for your future anticipated sales.
- Determine your target food costs. You will use this to inform your forecasted budget in the setup steps below. If you rely on an existing budget, prepare to import it into xtraCHEF.
Once you have a good baseline of data, you're ready to begin using the budget tool to manage your income and expenses.
Budget Setup
To navigate to the budget page, select Budget from your left hand navigation rail. This page contains three tabs: the main Dashboard (default view), your Budget creator, and an Import tab that will allow you to import existing budget information.
Manually Add or Edit Budget Information
In order to populate your budget tool with Estimated Sales and Estimate Budget values, you will first need to input your monthly budget. You can do this manually by following the steps below or you can fill out and import a budget template. Importing is the fastest method for configuration if you have budgets already established by accounting periods.
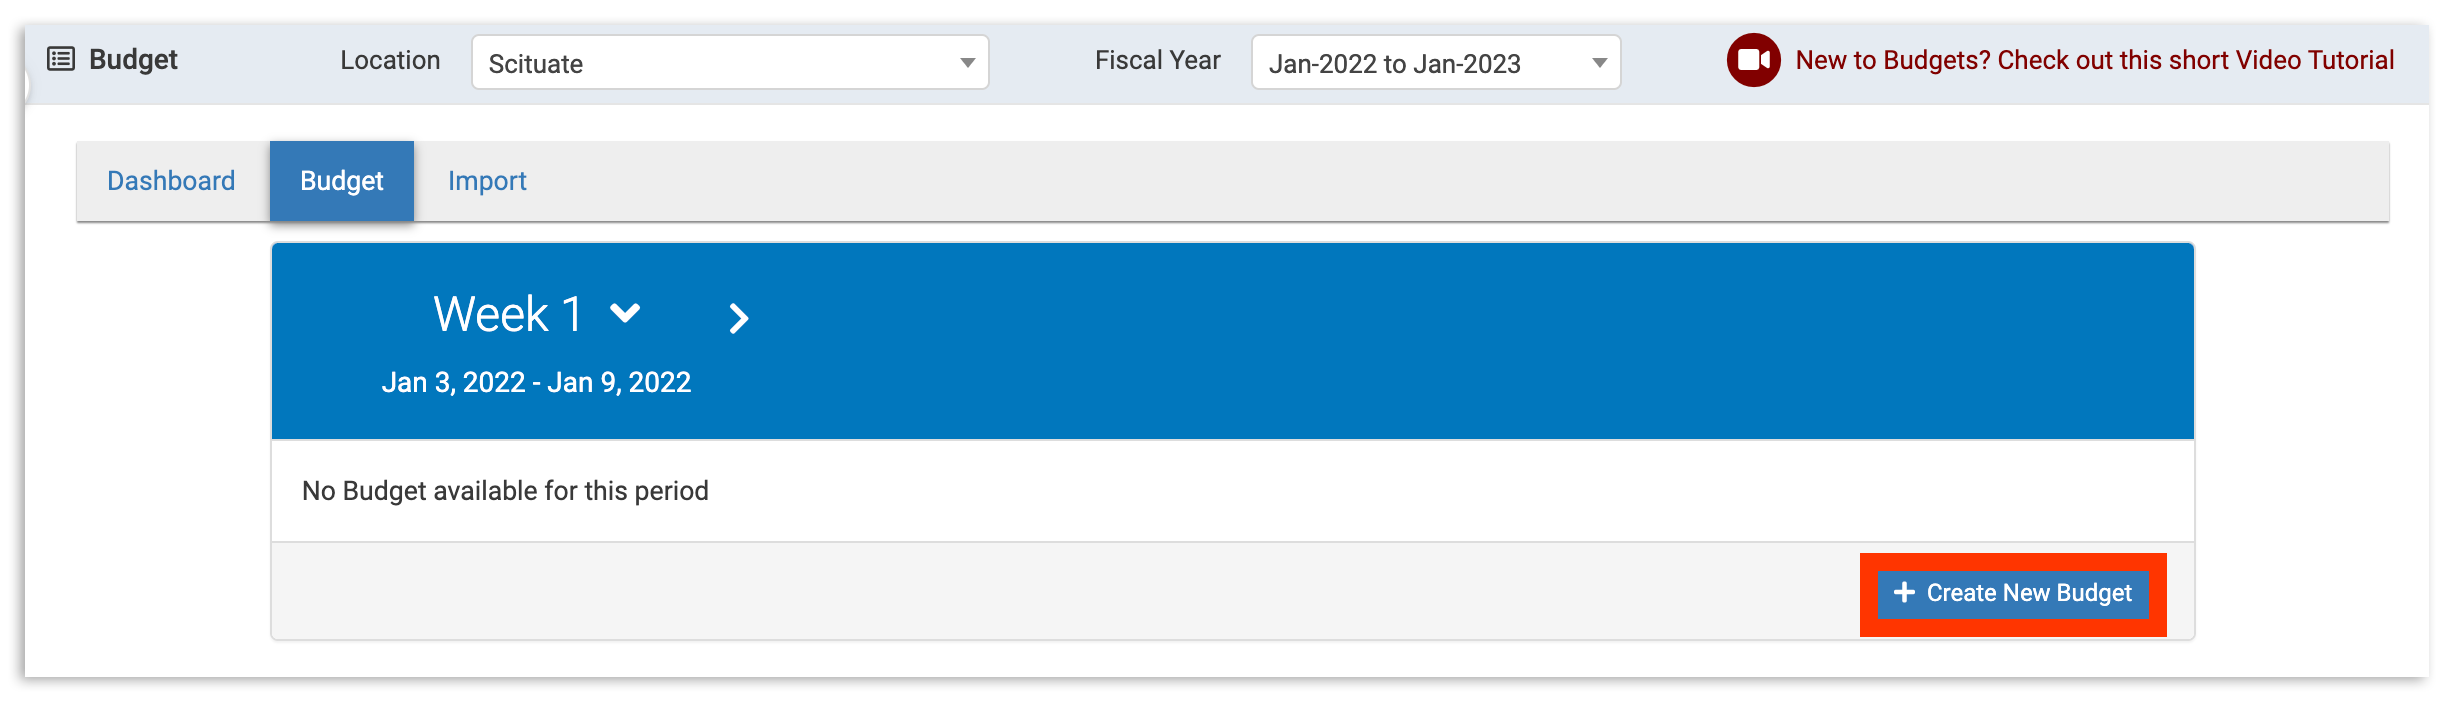
To manually input your monthly budget, select the Budget tab. Above that tab, select the Location you wish to establish a budget for and the Fiscal Year. Then select + Create New Budget.
You will then be prompted to select either Copy Previous Month Budget (if applicable) or create new values via Empty Budget.
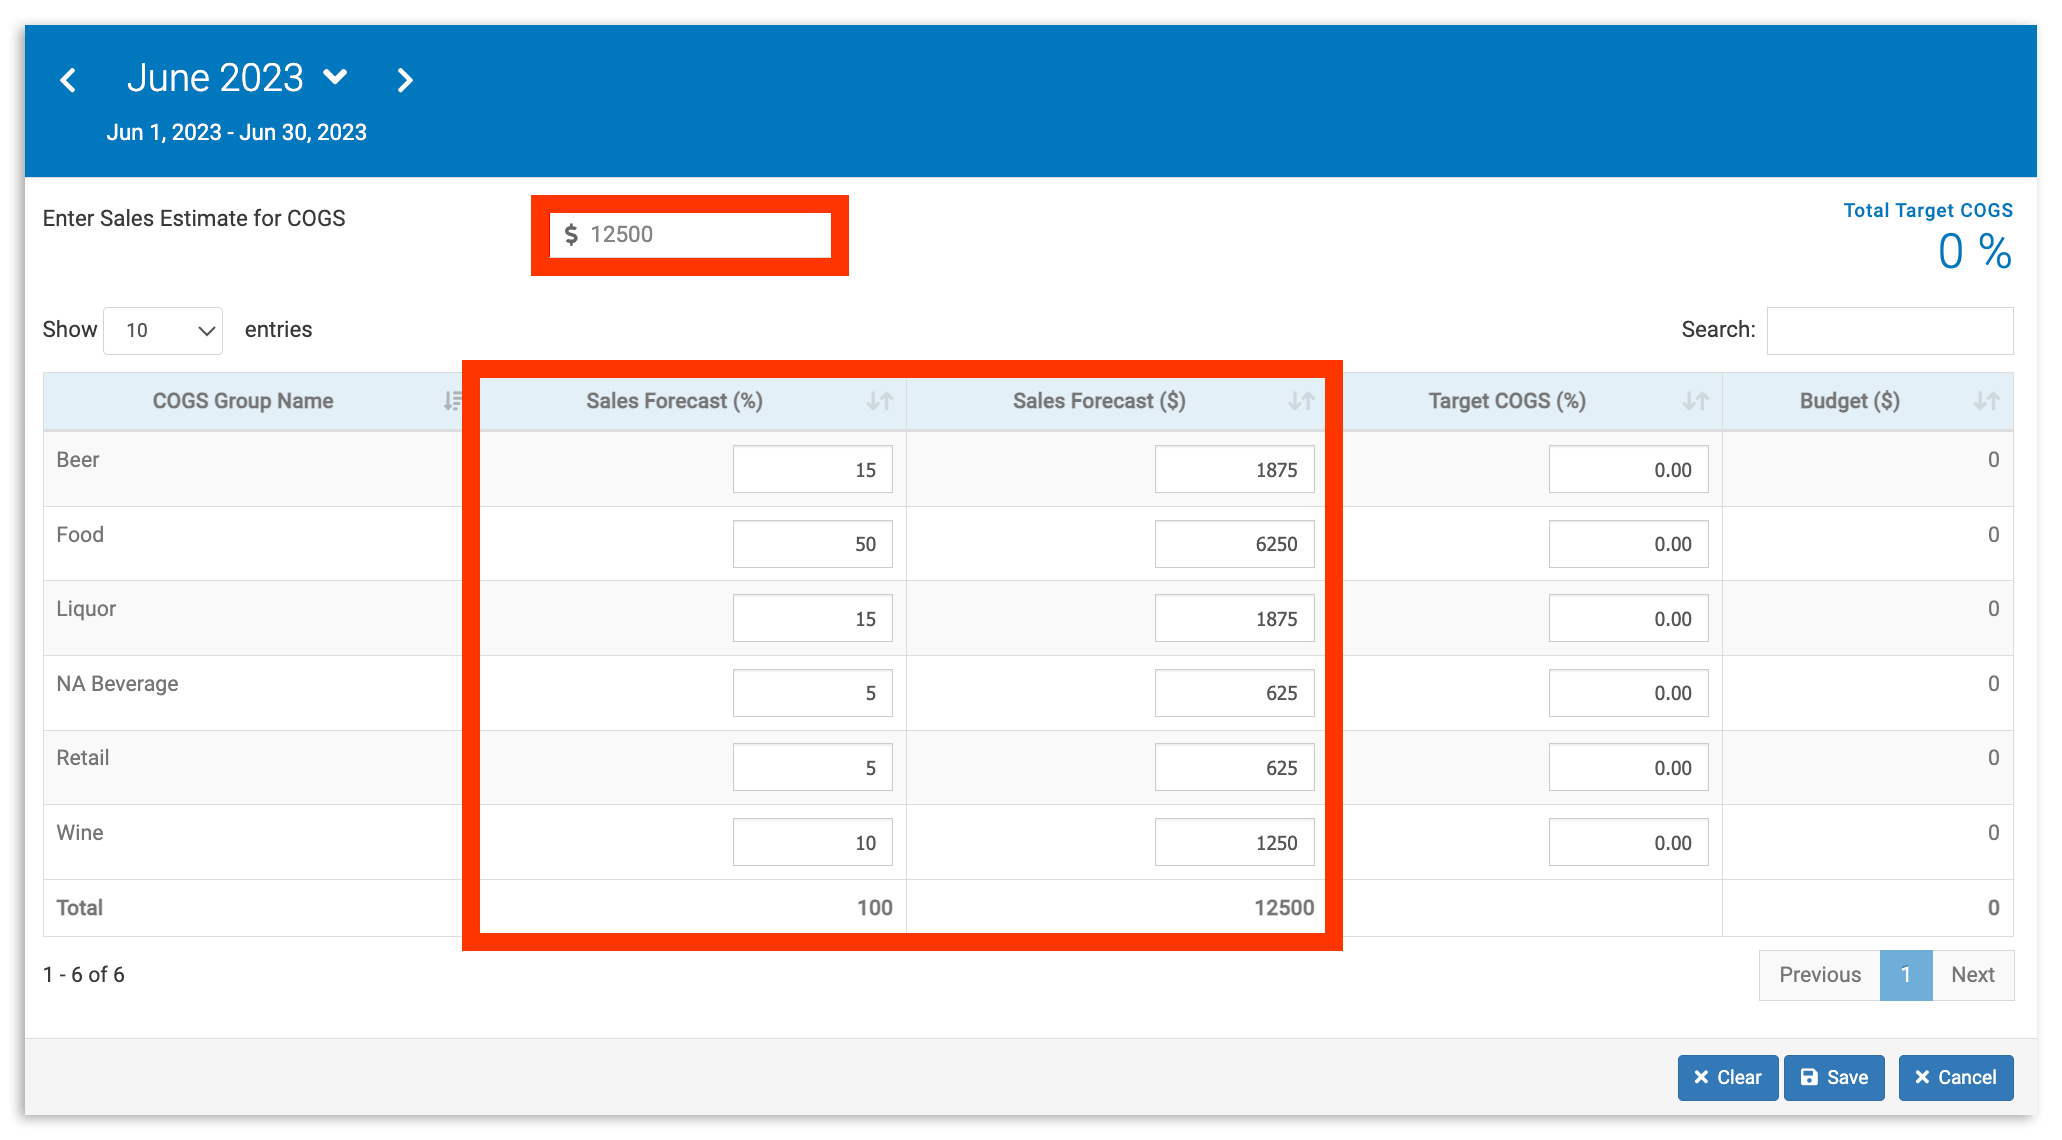
If you select Empty Budget, you will be prompted to Enter Sales Estimate for COGS. This is your total spend for the period (as determined by your accounting period setup). You can also divvy your total sales estimate out by COGS Group, applying Sales Forecast values by percentage (%) or dollars ($). Doing so will allow you to monitor budgets at the individual COGS level later on.
Note: Your COGS groups are pulled automatically from your existing data and can't be edited here - if you need to add or update your COGS, you will have to do so separately.
Next, indicate what your Target COGS (%) is per period. To do this, you'll first need to determine how much of your total monthly revenue you plan to spend on each COGS group. Keep in mind that these percentages don't necessarily correlate to your projected revenue.
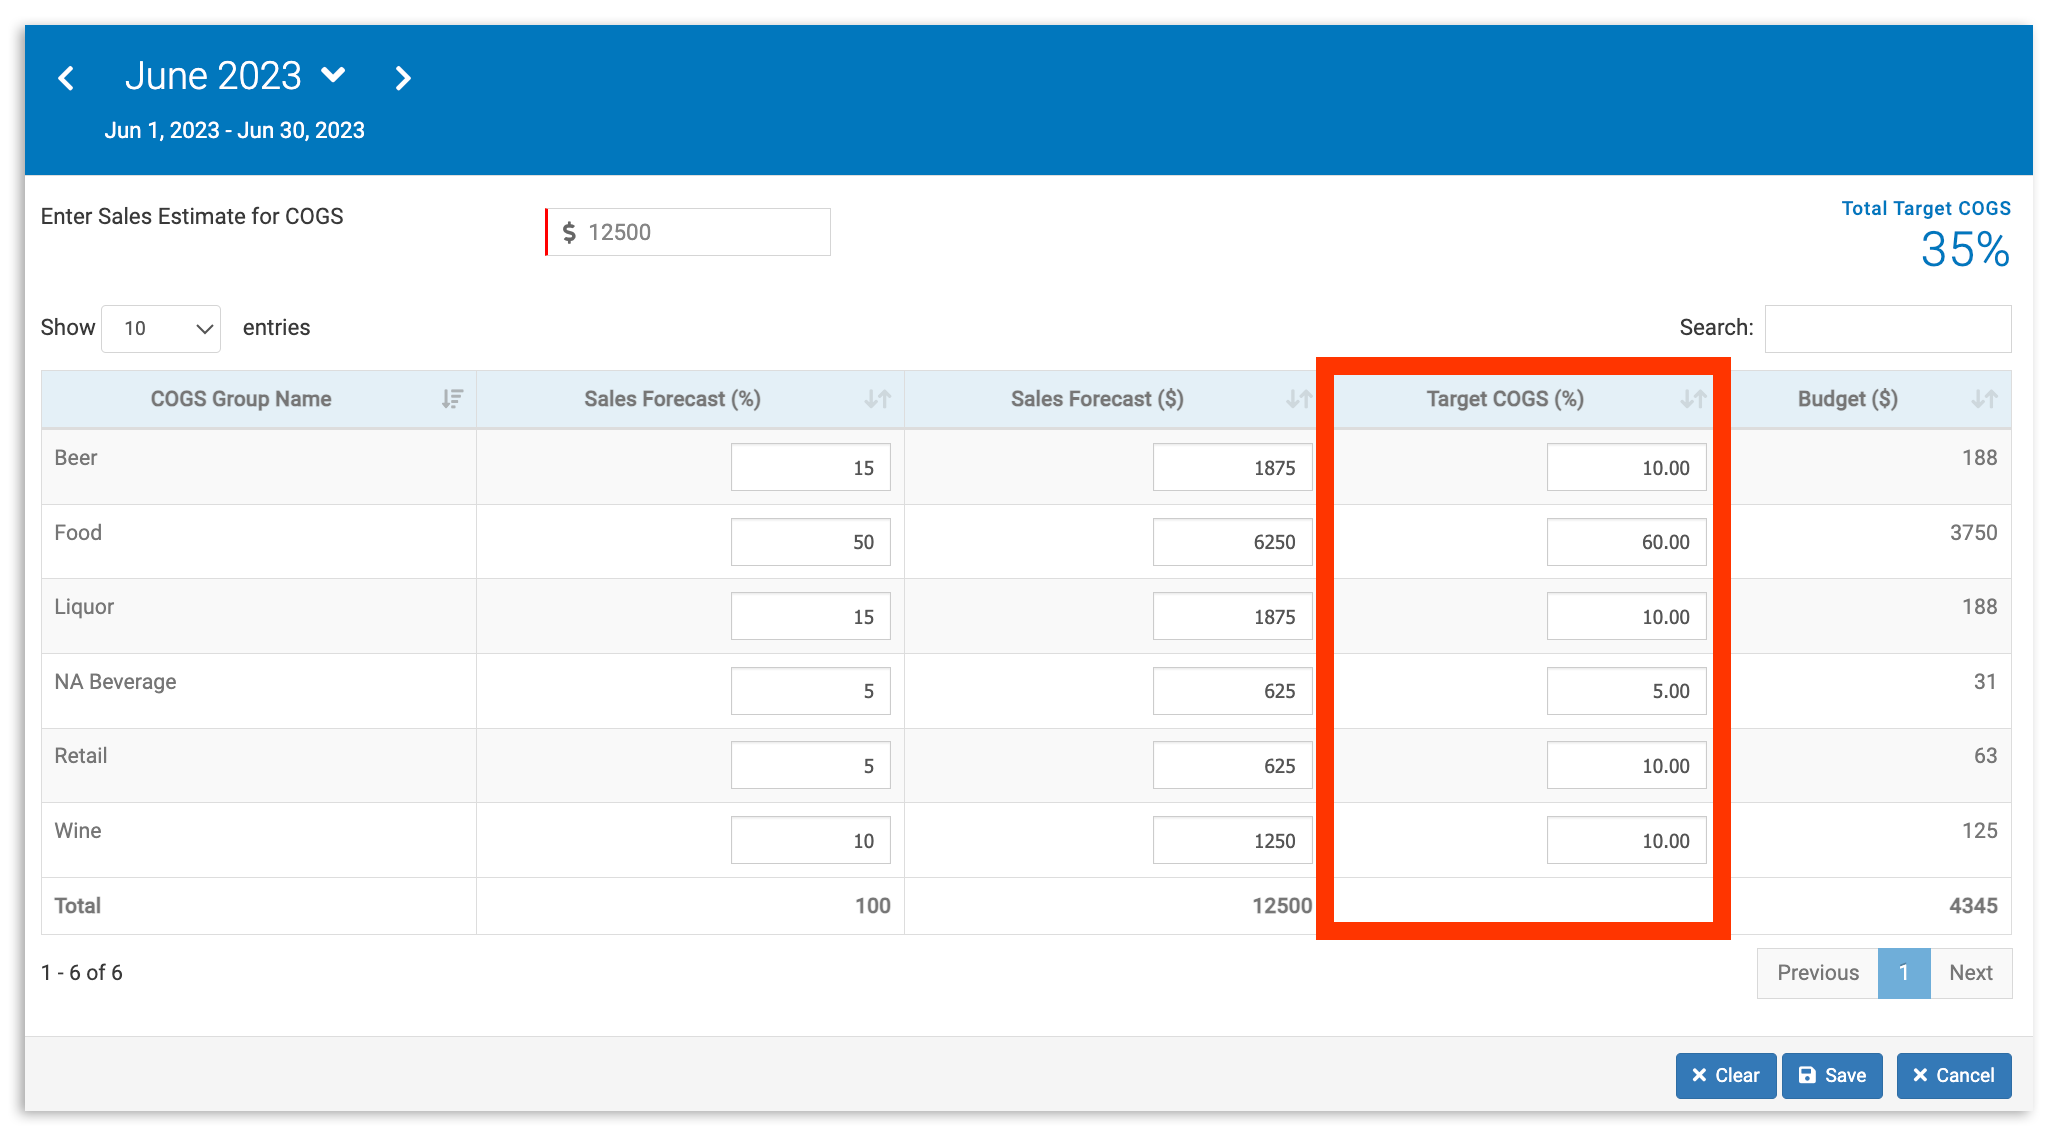
Once you've added your budget numbers, select Save. A confirmation message will then appear, notifying you that your new budget has been added successfully.
Import Existing Budget(s)
Does your organization already have budget information? Rather than adding information for each period manually, you're able to import this data in a spreadsheet format. To begin, select the Import tab.
Your imported data will need to be in our spreadsheet template in order to successfully import. To download this, select Download Budget Template. This will download a file titled "BudgetTemplate.xlsx".
To fill out this template, open the file from your computer. Once loaded, you land on a tab titled Notes that includes general guidelines for filling in and importing the template spreadsheet. Proceed by selecting Budget (highlighted below).
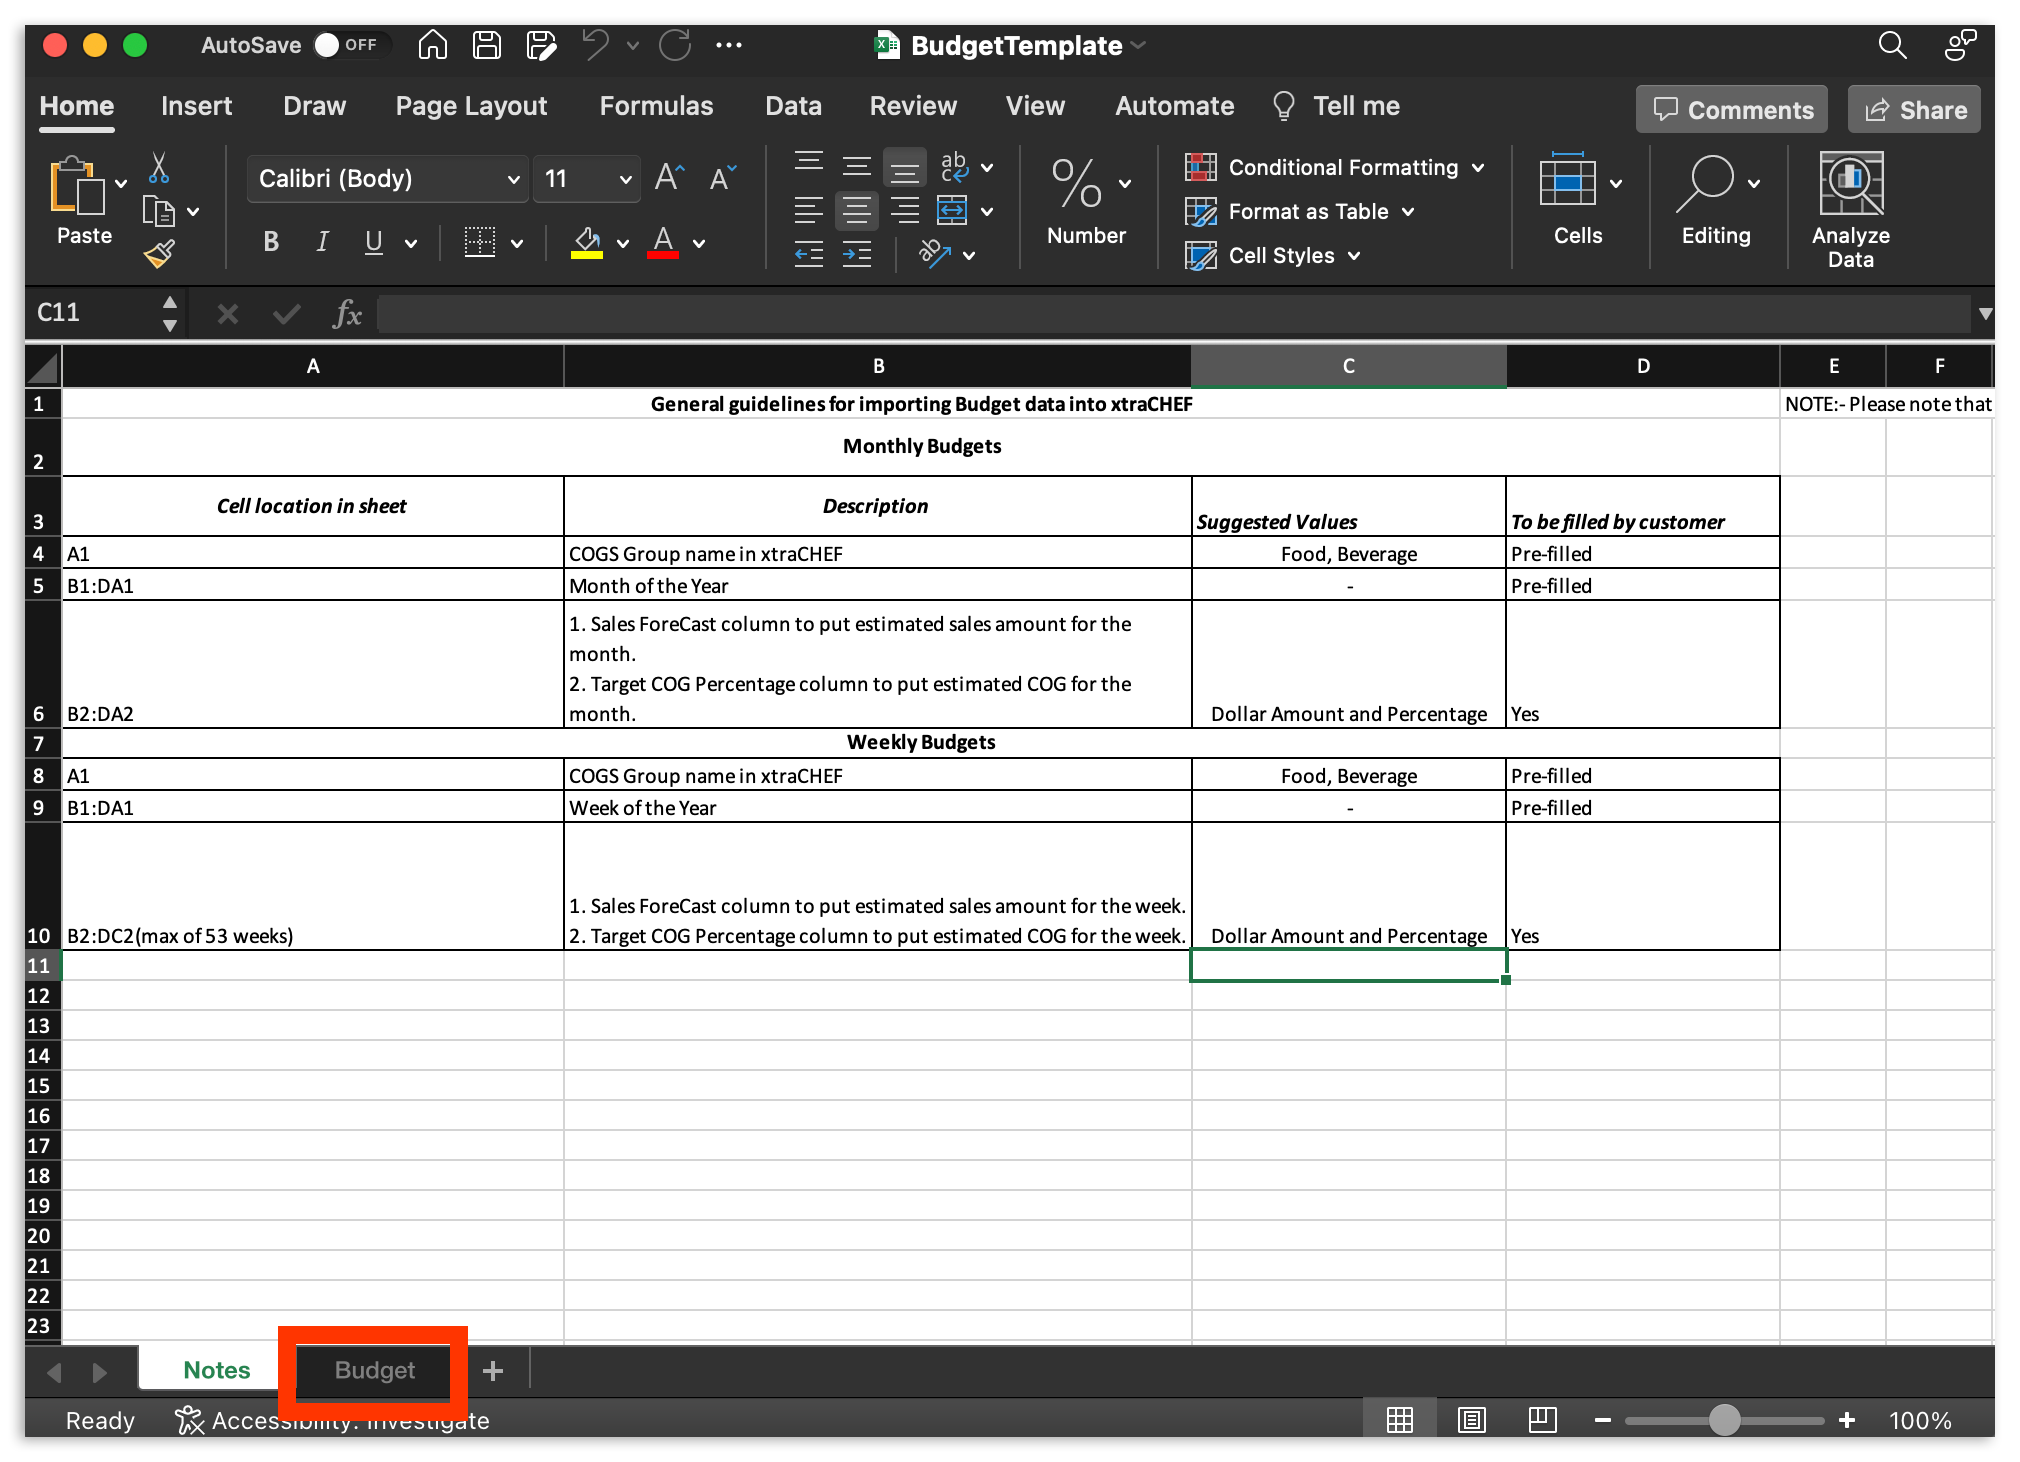
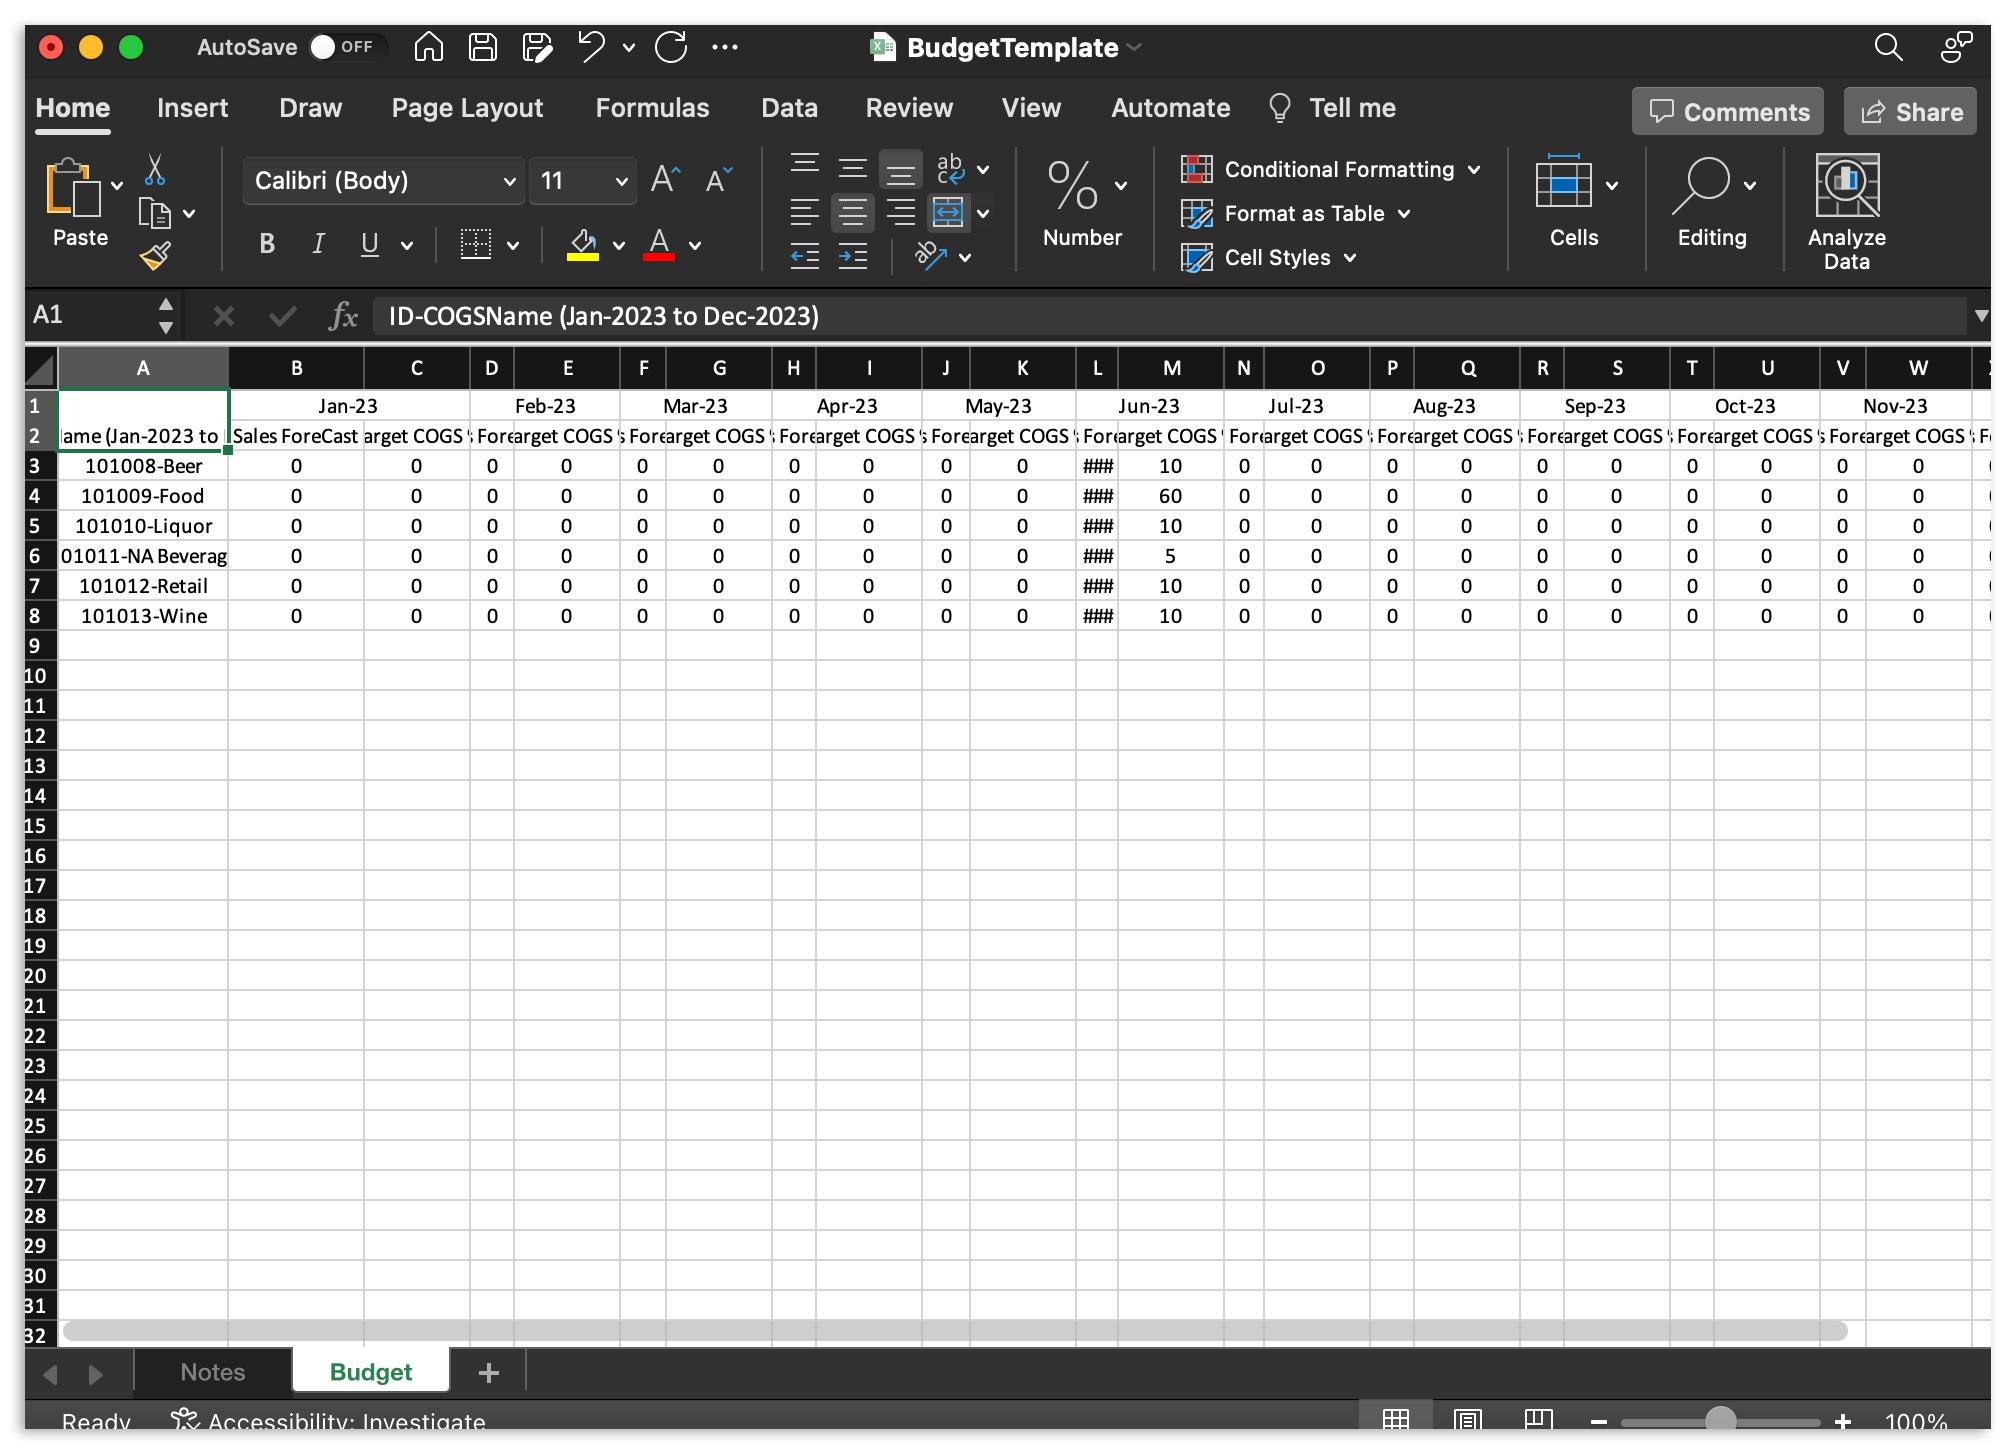
Your Budget tab will show the spreadsheet fields.
| Row or Column | Description |
| Row 1 | Do not edit this row. This field is filled in on your behalf and labels the Accounting Period. |
| Row 2 | Do not edit this row. This field is filled in on your behalf and labels columns as either Sales Forecast or Target COGS. |
| Column A | Do not edit this column. This column is filled in on your behalf and labels the COGS Group/GL Code that your Sales Forecast or Target COGS values will report to. |
Continue by attributing a Sales Forecast amount and Target COGS percentage to your Accounting Periods. When your spreadsheet is ready, save it to your computer and return to xtraCHEF.
In xtraCHEF, select Import Budget. This will prompt you to select the file from your computer. Select the file and complete your budget import.
Note: For multi-unit operations, make sure you're uploading your spreadsheet to the correct location.
How to Use Your Budget Tool
Once you've entered your information using either the Budget or Import tabs, you're ready to put that data to use.
Budget Dashboard
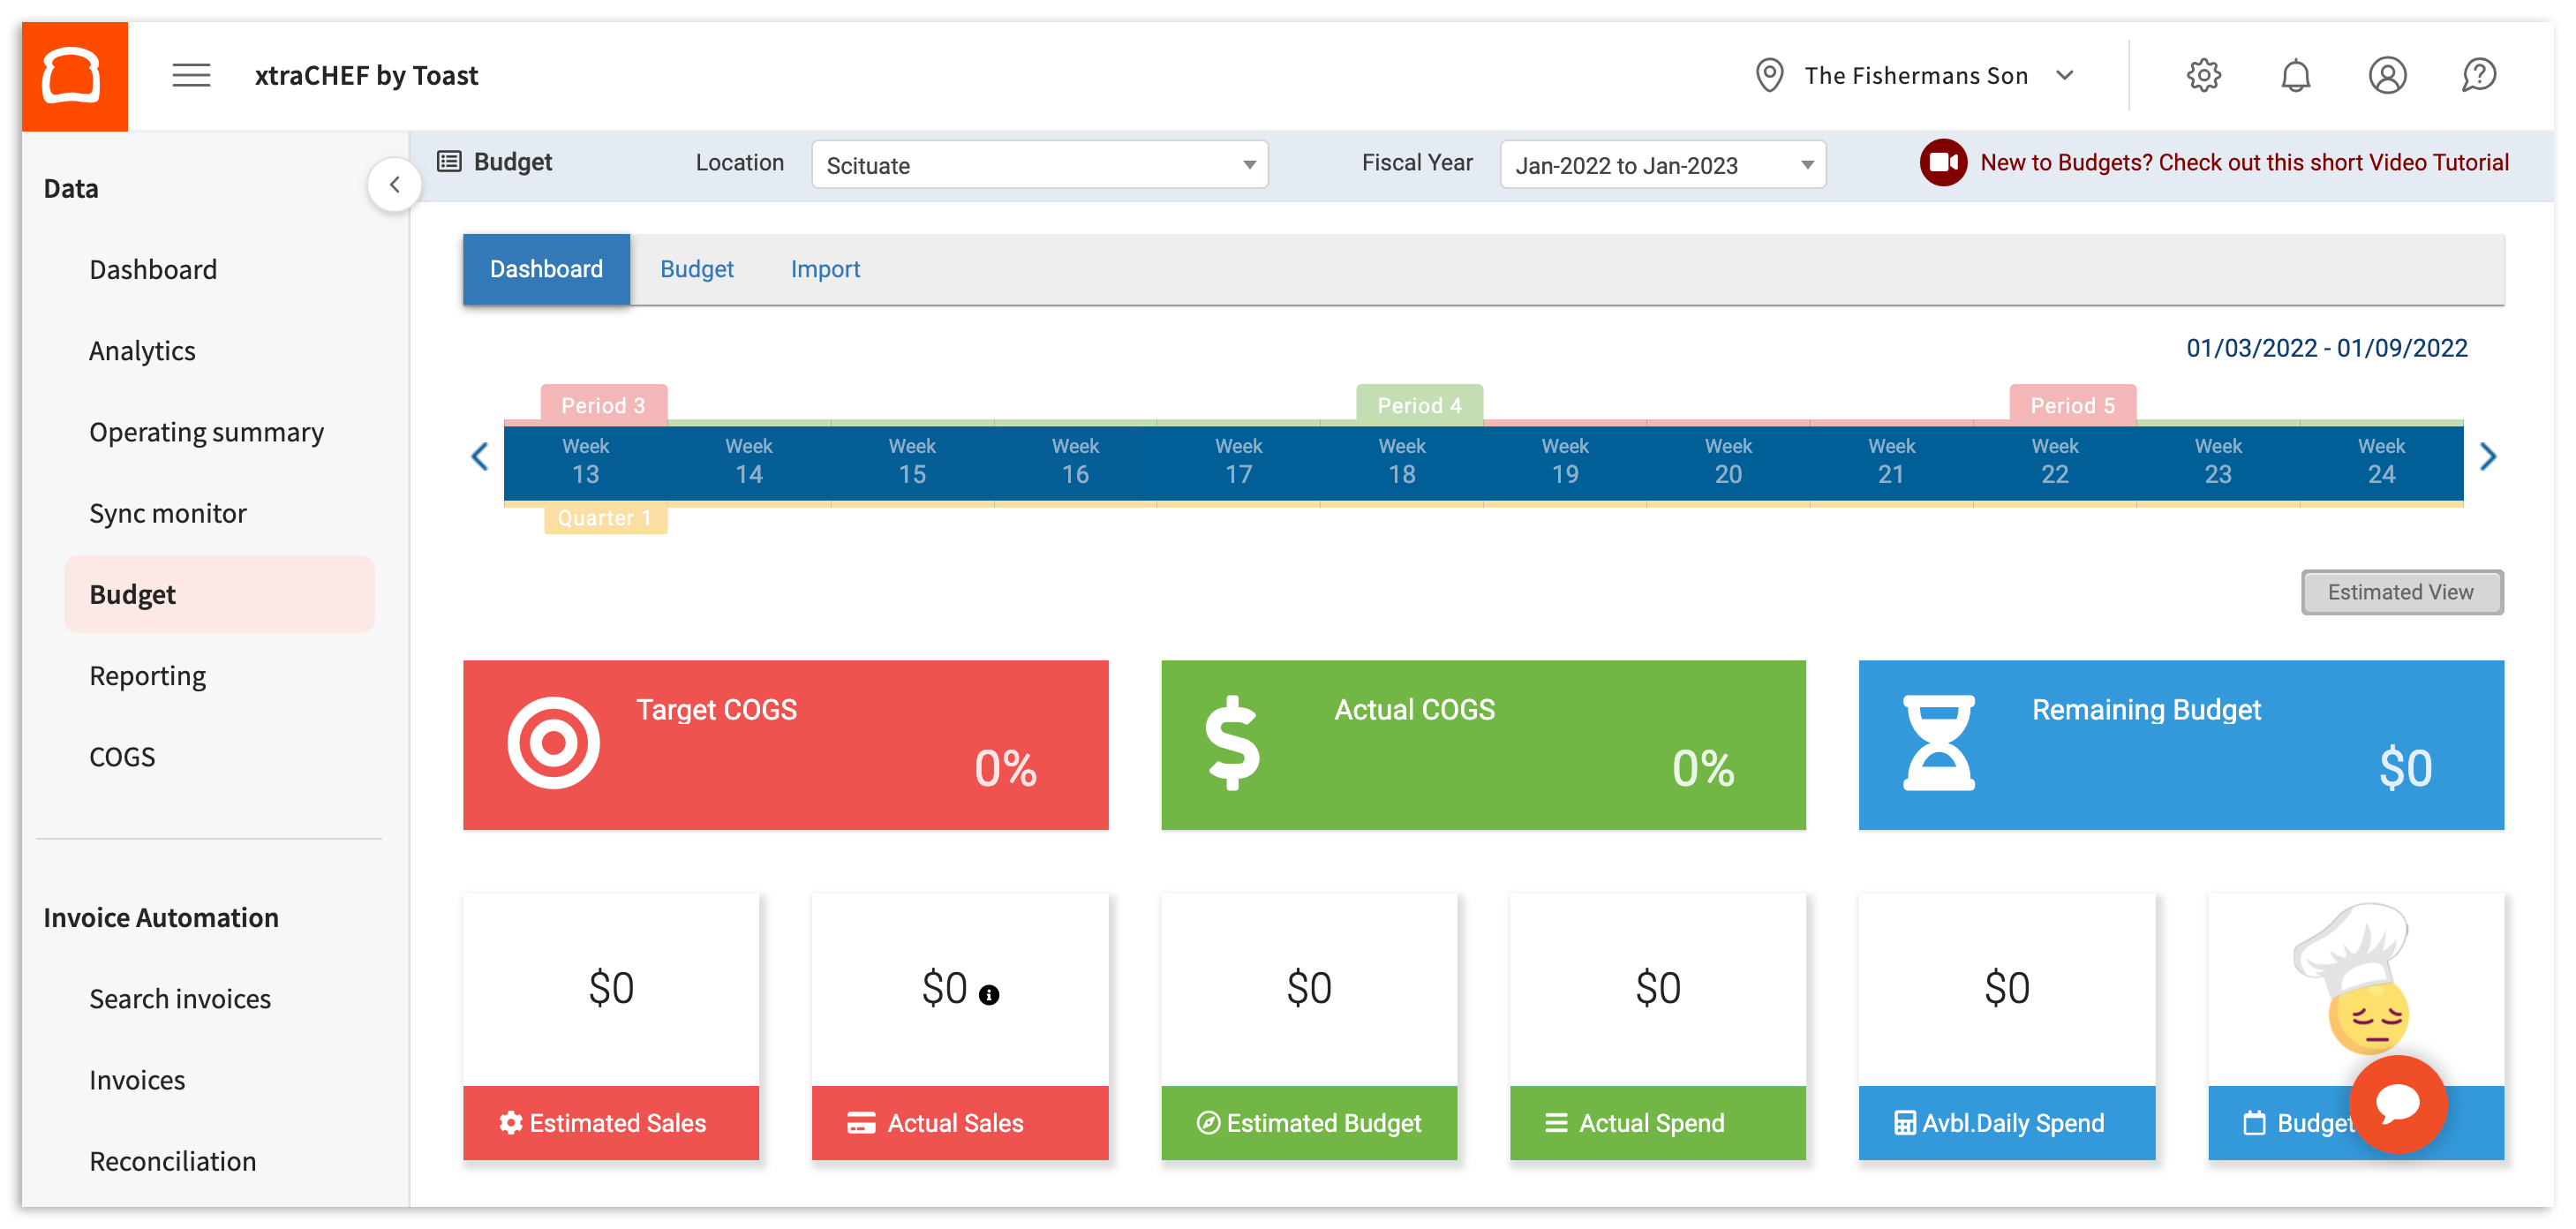
To get insights into your spending and overall budget health, navigate to the Dashboard tab within your Budget page.
The Dashboard's default display is the current accounting period and your most recently viewed location. To ensure you're looking at the correct data, be sure to choose your Location and the Fiscal Year you wish to view from the drop-down menus at the top of the page.
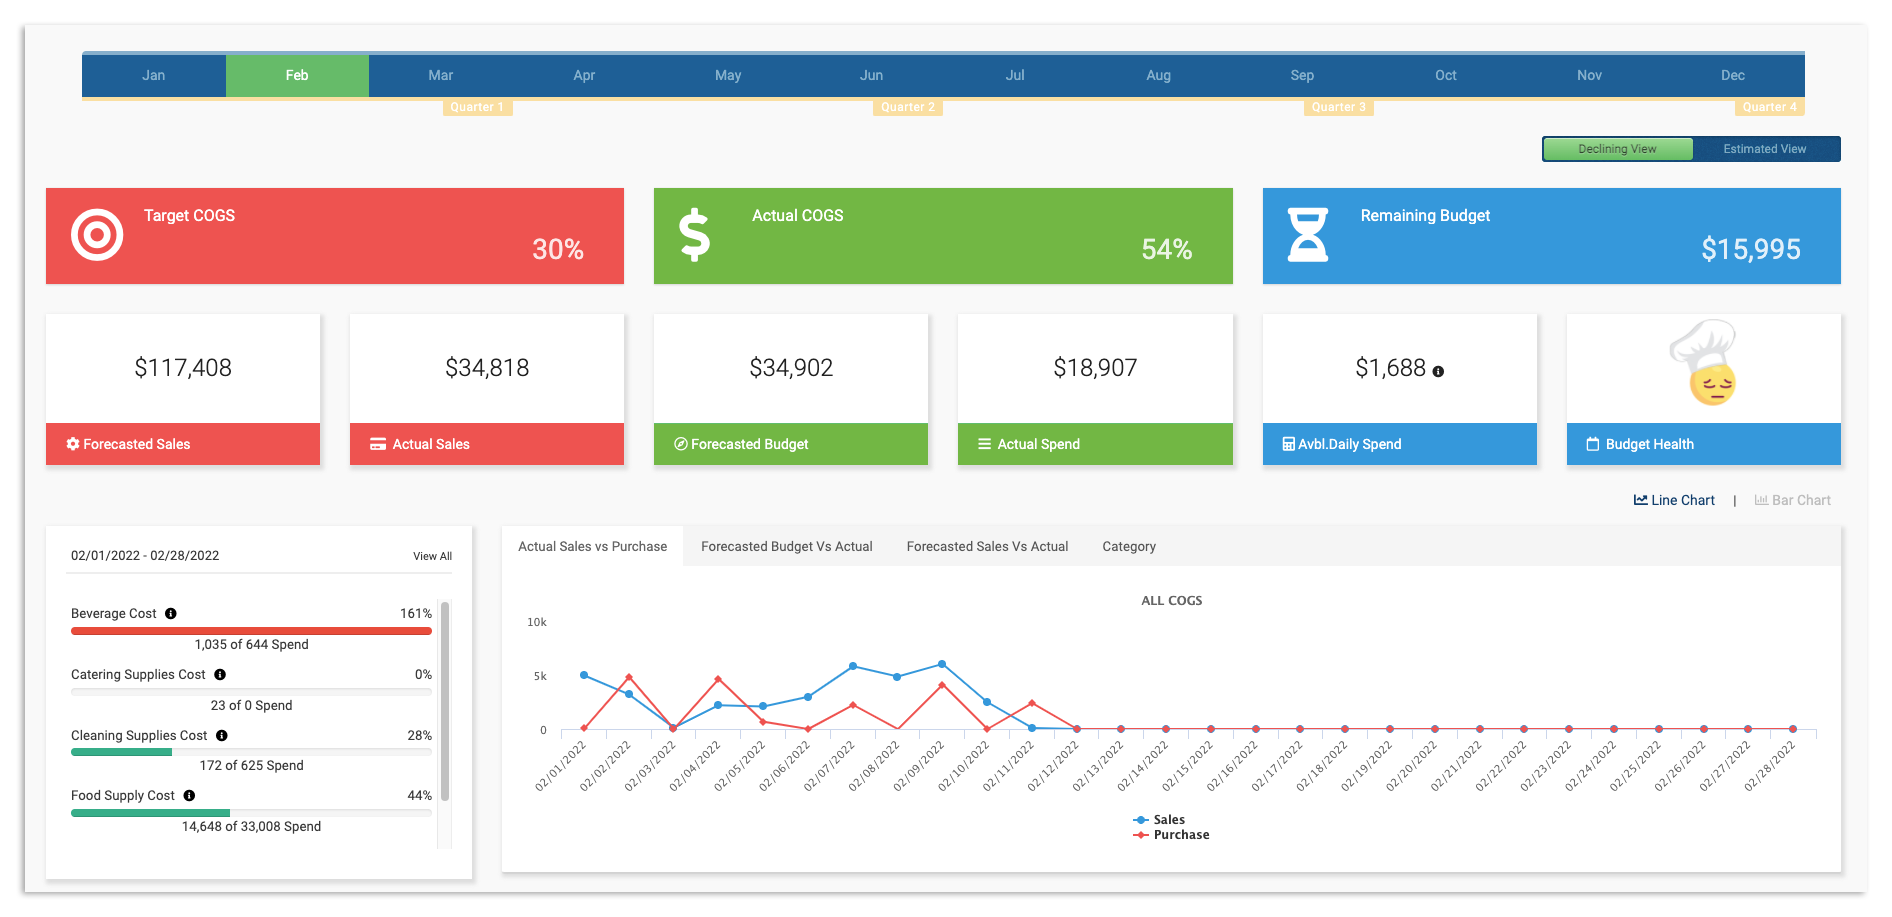
Here, you are able to view the dashboard by Declining View (default) or Estimated View using the slide in the top right corner of your screen (pictured below).
Insight Breakdown
Your first row of insight on the dashboard includes Target COGS, Actual COGS, and Remaining Budget.
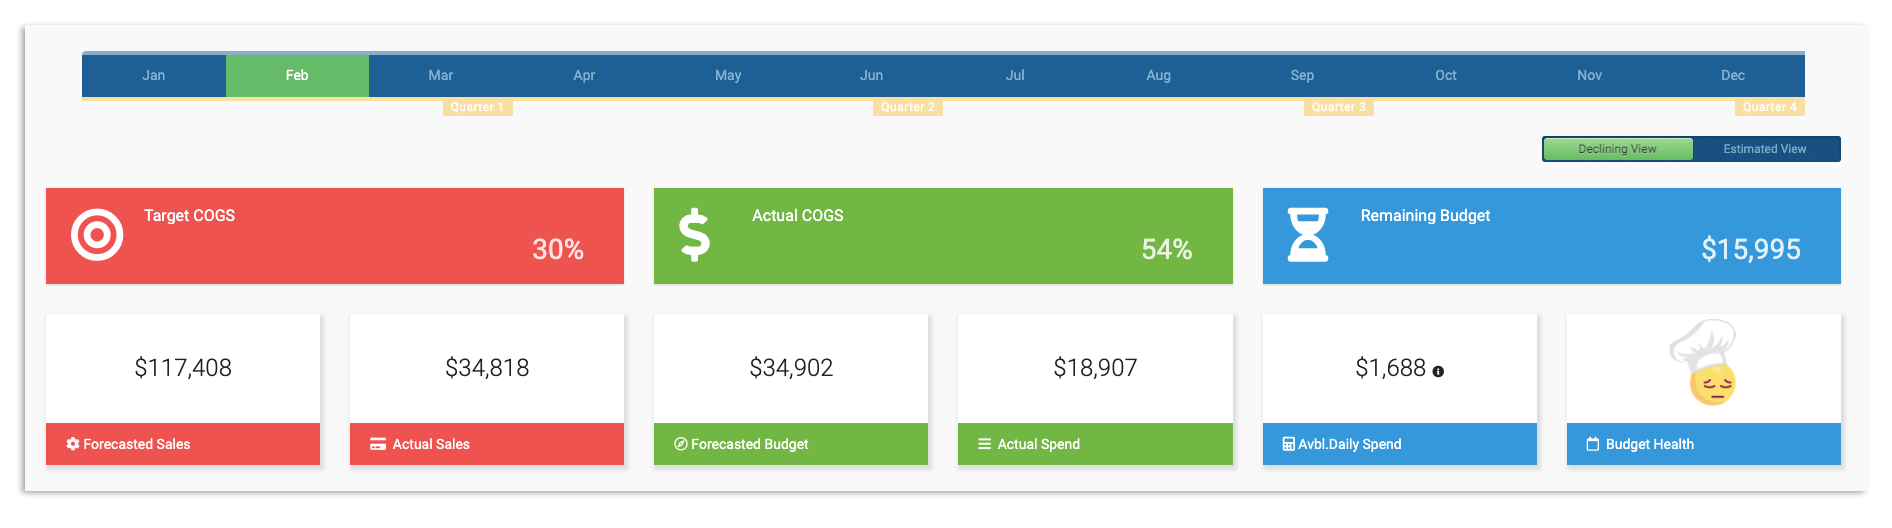
Let's dive into each of these insights and their definitions in the chart below.
| Dashboard Tool | Definition |
| Target COGS | The comparison percentage between your Estimated Sales and Actual Sales. |
| Estimated Sales | Your estimated sales per period, as determined in your Budget tab. |
| Actual Sales | Your actual sales per period, as determined by sales totals read from your Toast POS. |
| Actual COGS | The comparison percentage between your Forecasted Budget and Actual Spend. |
| Estimated Budget | Your budget per period, as determined in your Budget tab and based on your Sales Estimate for COGS total and Target COGS (%) percentage. |
| Actual Spent | Your spend per period, as determined by uploaded and reconciled Invoice totals. Pro tip: To ensure this amount is 100% accurate, we recommend uploading all bills and payables to your xtraCHEF account. |
| Remaining Budget | The difference between your Estimated Budget and Actual Spend. |
| Avbl. Daily Spend | The remaining budget value by day, as determined by comparing your Remaining Budget by period to the remaining days. |
The second row of tools includes your Cost breakdown and line/bar charts (which displays the same information in different fashions).
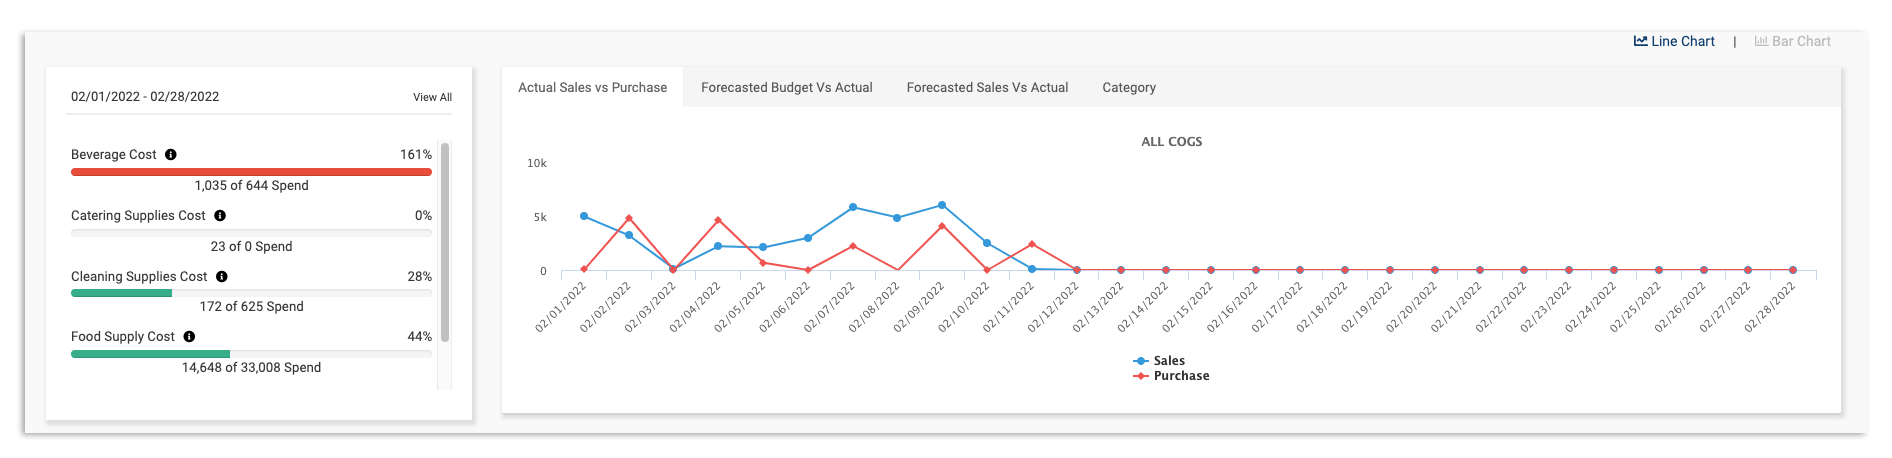
Let's dive into each of these insights and their definitions in the chart below.
| Dashboard Tool | Definition |
| COGS Group Cost | Your cost breakdown by COGS Group, as determined by comparing your Target COGS Percentage to your current spend by COGS per period |
| Actual Sales Vs Purchases Chart | A comparison and visual (either line or bar chart) that compares your Actual Sales (synced from Toast POS) to your Actual Purchases (read from uploaded and reconciled invoice uploads) |
| Estimated Budget Vs Actual | A comparison and visual (either line or bar chart) that compares your Estimated Budget per period (determined in your Budget tab) to your Actual spending (read from reconciled invoice uploads) |
| Estimated Sales Vs Actual | A comparison and visual (either line or bar chart) that compares your Estimated Sales (determined in your Budget tab) to your Actual sales (synced from Toast POS) |
| Category | A comparison and chart that shows your Total spend (read from uploaded and reconciled invoice uploads) and cost ratio by Category |
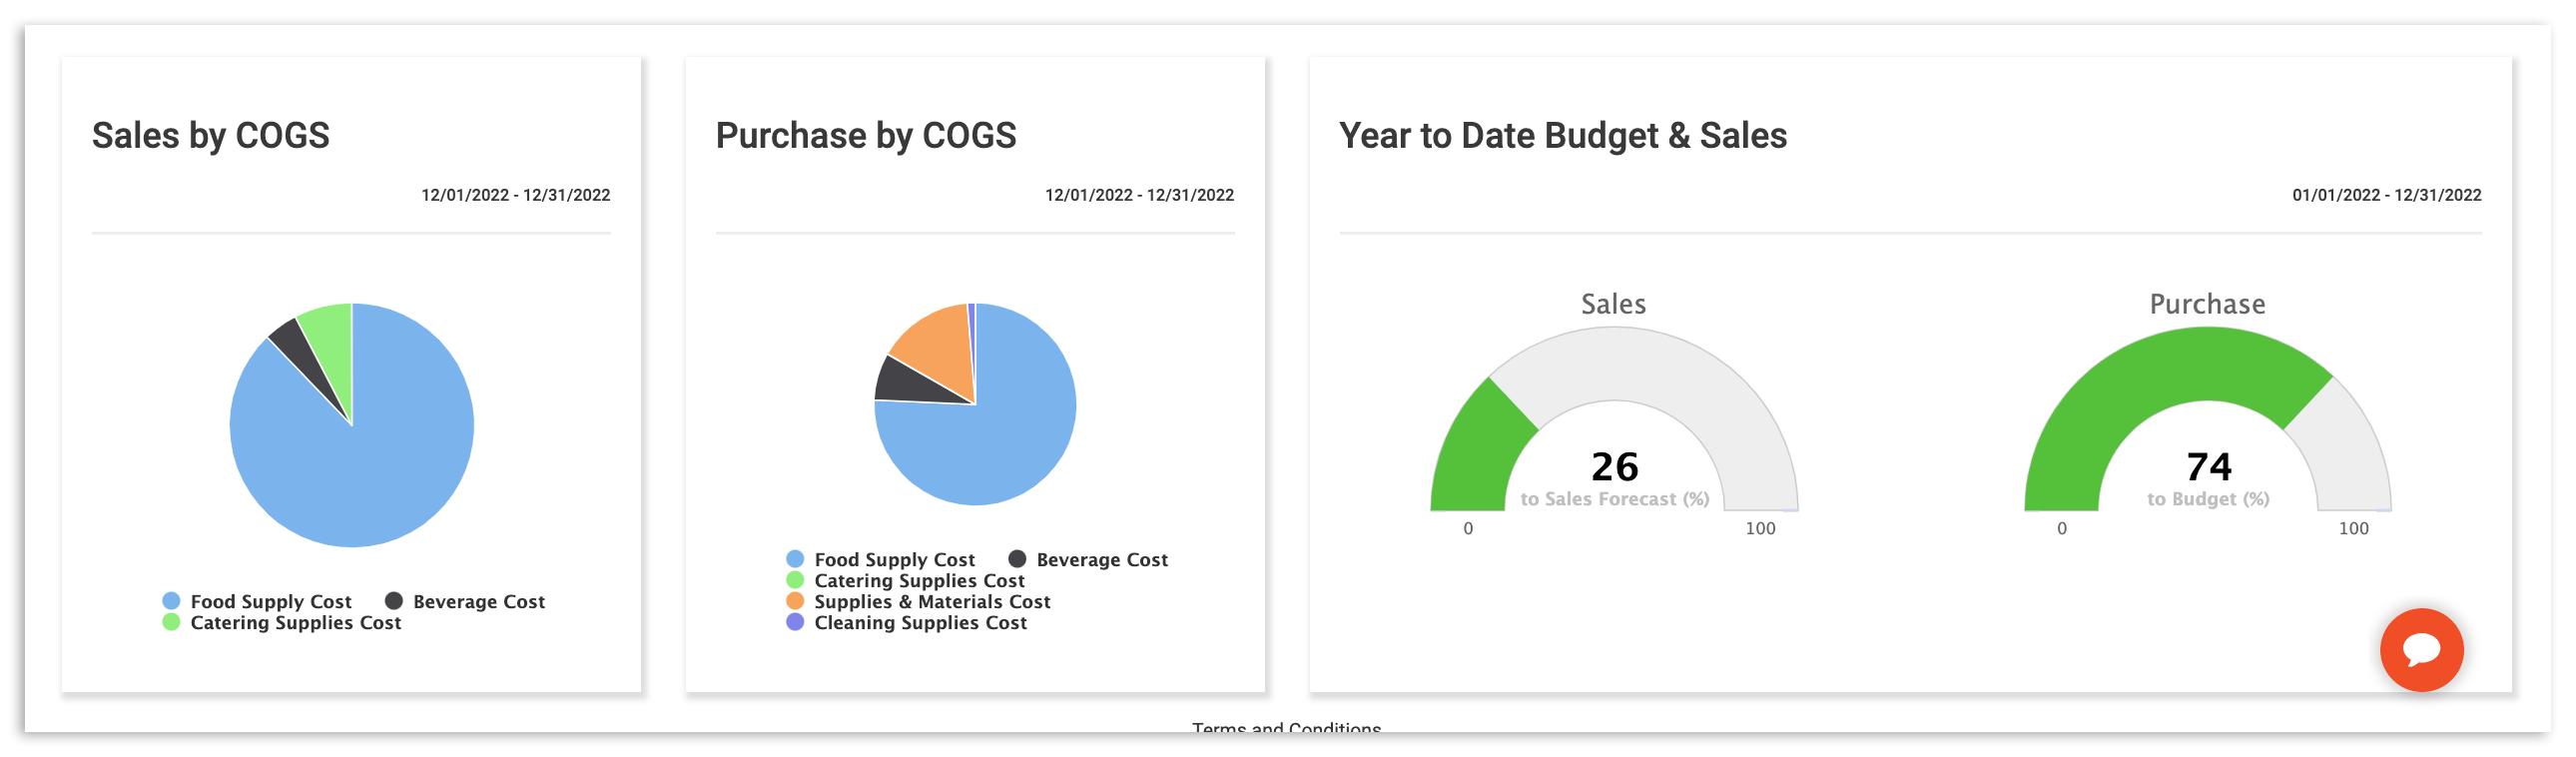
Additional charts on your Budget Dashboard include Sales by COGS, Purchase by COGS, and your Year to Date Budget & Sales.