Labor Cost Breakdown Report Overview
Last updated: Apr 8, 2026, 10:14 AM
- Labor Cost Breakdown Report Introduction
- Filter and Display Options
- Export the Labor Cost Breakdown Report
- Labor Cost Breakdown Data Overview
- Additional Resources
Labor Cost Breakdown Report Introduction
The Labor Cost Breakdown report gives you a look into labor spending to help you make informed decisions about staffing and scheduling based on hourly labor costs. Use this report to break down labor costs by job title and employee, by hour, by day, and by week. If you have more than one location, you will have the option to view a breakdown of labor costs by location.
To view the Labor Cost Breakdown report in Toast Web navigate to Reports > Labor > Labor cost breakdown.
Note: To view this report in Toast Web, you must have the following permissions: 4.1 Sales Reports, 4.3 Labor Reports, and 4.10 Employee Jobs & Wages. To learn more about user permissions, check out the Permissions Reference Guide.
Back to top
Filter and Display Options for the Labor Cost Breakdown Report
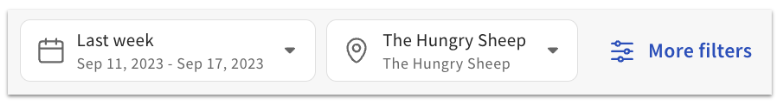
At the top of the report, you’ll see date and location filters. Use the drop-down menu to select from different pre-set options (yesterday, today, this week, etc.), or select Custom date to choose a specific range for your report.
The report will update for pre-set date filters automatically. If you choose a custom date range, you’ll need to select Apply to update the report. There is no date range limit for this report.
Note: A Customer Care representative can change the first day of the week to start on Sunday or Monday for your reports (whichever you prefer), and can verify your start of the week if you're unsure of what it’s currently set to.
Next to these drop-downs, you’ll also see the More filters option, which will open up a filter menu on the right side of the screen with the ability to adjust your report for custom hours, day of the week, job title, revenue center, and sales categories.
The gear icon in the top right corner of the page will open the Report settings configuration.
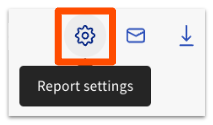
Here, you can adjust several settings that impact your report:
- Select the metric used for labor calculation (Net sales or Gross sales)
- Show or hide the data chart
- Select your labor hours display format (Decimals (5.5) or Hours and minutes (5h 30m))
- Hide hours, days, or weeks with no data (in either the chart, the table, or both)
The Labor Cost Breakdown report will automatically update to reflect the changes you make to report settings.
Back to top
Export the Labor Cost Breakdown Report
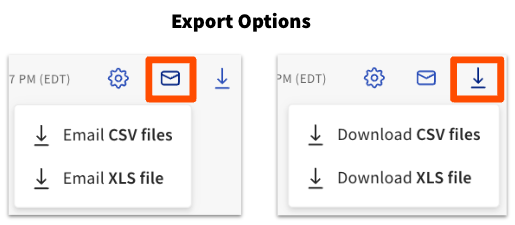
You can export the Labor Cost Breakdown report via email or download the data as a CSV or XLS file. Select either the email icon or the download icon (down arrow) in the top right corner of the report, and choose your desired file type.
Labor Cost Breakdown Data Overview
The data in the labor cost report is displayed in 3 sections: the overview header section, a labor cost chart, and a detailed data table.
The header section displays four key metrics for your selected location and date range:
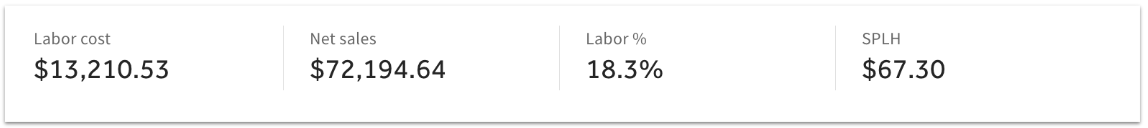
- Labor cost - the total of all labor costs for the selected range
- Net sales or gross sales (depending on your selected report settings)
- Labor % - labor cost divided by net sales or gross sales (depending on your selected report settings)
- SPLH - sales per labor hour (net sales or gross sales divided by total labor hours)
Note: Labor cost calculations currently don’t include salaried jobs.
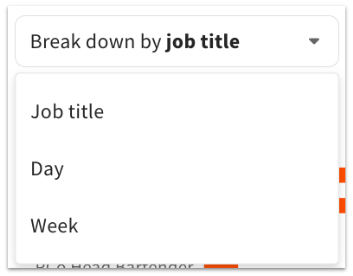
The labor cost chart can show you a breakdown of labor costs by job title, hour, day, or week – you can switch between those options using the drop-down menu. The time metrics available will depend on the time range you’ve selected for the report.
- If you’re viewing 1 day of data, you break down by hour
- If you’re viewing between 2 and 13 days of data, you can break down by day
- If you’re viewing 14+ days of data, you can break down by day or week
Hover over any bar on the chart for detailed data:
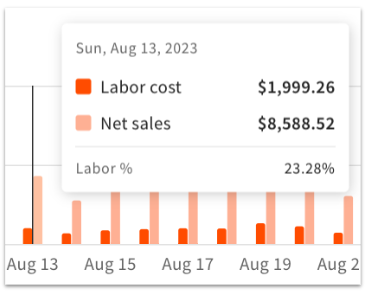
Underneath the chart is a table breakdown of the data for the selected location and date range. The data in the table will update to reflect the selection you chose from Break down by drop-down.
When Break down by job title is selected, you can select any job title in the table to open up labor cost details by individual employee.
Use the Columns button above the table to select or deselect the fields you’d like to include on the table. The available columns can include the following fields, depending on what you’ve selected from the Break down by drop-down:
|
|
|
You can click on any column title to sort the data in the table in ascending or descending order.
Back to top
Troubleshooting: No Data Visible on the Labor Cost Breakdown
If there’s no data showing on your Labor Cost Breakdown report, it may be due one of these reasons:
- No job titles are set up, or employee wages were not set properly. For more information, see this Support Center article: Create and Edit Jobs (Roles) for Toast POS.
- A data range with no data was selected (like a day the restaurant was closed, or a future date)
- There are no sales or labor data for that day
- You don’t have the required permission to view sales/labor data (4.3 Labor Reports)
- Job title does not have Include hours and pay under this job in restaurant labor summary reporting selected.
Additional Resources for Reporting