Get Started With Analytics and Reports
Last updated: Apr 30, 2026, 5:54 PM
Learn about the available reports on Toast Web and some helpful information on how you can navigate them.
- About Toast analytics and reports
- Report categories
- Filter reports
- Customize report columns
- Export and download reports
- Known limitations
- Related articles
About Toast analytics and reports
Toast includes a built-in reporting suite available to all restaurant owners and managers with the appropriate permissions. Reports update in real time and cover every major area of your business.
Where to find it: In Toast Web (also called the back-end), select Reports in the left navigation menu to open your reporting dashboard — the Weekly Overview. Select the arrow (>) to expand the full report list.
Who can use it: Any user with reporting permissions assigned in Toast Web. Some report categories require specific modules — for example, Kitchen Operations reports require the Kitchen Display System (KDS).
What you get: Over 40 individual reports organized across nine categories: Sales, Labor, Menus, Payments, Cash and Loss Management, Accounts, Kitchen Operations, Marketing, and Other.
Report categories
Each category below links to a full overview article describing the individual reports in detail.
| Category | What it covers | Reports included |
|---|---|---|
| Key sales metrics, breakdown by day, day of week, time of day, payment type, and sales category | Sales Summary, Sales Analytics, Sales Breakdown, Marketing-driven sales, Digital Order Sources, Orders, Order Details, Paid in Total, Deposit Sales Collected, Location Breakdown, Group Sales Overview | |
| Hours worked, pay, tips, and time entries; filterable by date, shift, and employee | Labor Cost Breakdown, Time Entry Management, Time Entry Reporting, Hourly Sales, Employee Productivity, Labor Summary, Manager Swipe Card Log, Location Overview, Shifts, Pooled Tips, Break Entries, Break Adherence, Time Entry Audits | |
| Top-performing menu groups, items, and modifiers; product mix (PMIX) breakdown | Product Mix (PMIX), Menu Breakdown, Top Menu Items, Top Menu Groups, Top Modifiers, Item Details, Modifier Details, 86 Report, Food Waste Breakdown | |
| Activity going into and out of the bank account linked to Toast | Payments, Payout Overview, Reconciliation, Processing Statements, Chargebacks, Settled Deposits Daily Breakdown, Deposits Total Overview, Daily Card Activity, House Accounts Transactions, Gift Card Balances, Gift Card Transactions, Inactive Gift Cards, Failed eGift Card Delivery, Billing & Invoices | |
| Cash drawer activity and loss prevention across one or multiple locations for a single day | Cash Activity Audit, Cash Drawer Overview, Drawer History, Voided Orders, Removed Items, Loyalty Misuse, Discounts, No Sale, Unpaid Orders, Refunds, Voided Payments, Tax Exempt, Offline Payments, End of Day, Check Sequence Log | |
| Financial overview by day, week, year, or location; GL codes and House Accounts | Accounting Overview, Accounting By Day, Accounting By Location, General Ledger Accounts | |
| Order fulfillment times, prep station traffic, and kitchen ticket details (requires Kitchen Display System) | Tickets by Fulfillment, Tickets By Hour, Ticket Details | |
| Guest contact data, rewards activity, and gift card data to support your marketing strategy | Guest Feedback, Guest Summary, Guest Credits, Rewards Accounts, Rewards Transactions, Fundraising Breakdown | |
| Other reports | Reservations and waitlist data; location comparison reports (also found in the Sales and Labor sections) | Guests Report, Bookings Report, Location Overview Report, Location Breakdown Report |
Important: Not all reports are visible to all users. If a report category or individual report is missing from your navigation, your user account may not have the required permission. See Why can't I access a report in Toast Web? for troubleshooting steps.
Filter reports
Most reports include a filter bar at the top. You can narrow data before viewing or exporting.
Basic filter options (available in most reports)
- Time frame: Filter by day, week, month, or a custom date range
- Hours: Filter by preset time frames or a custom hour range
- Employees: View all employees or specific individuals
- Location: Select one or multiple locations (available if you have more than one location)
- More: Add filters such as dining option (dine-in, takeout, online ordering, third-party delivery), revenue center, or service area
After changing any filter, select Update to refresh the report.
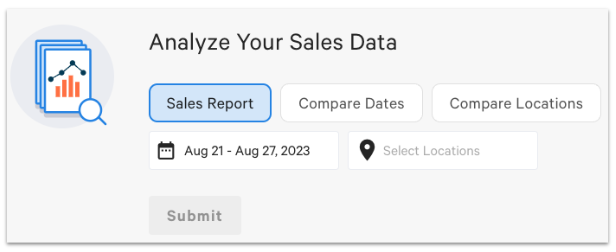
Comparative filter (available in Sales Analytics and some other reports)
Some reports offer a comparative view. Toggle between three modes:
- Sales Report: Standard view for a set time frame and selected location(s)
- Compare Dates: Choose two date ranges — compare your primary range to the same period in the prior year or the prior period
- Compare Locations: Compare performance across locations for a single time period (requires multiple locations)
In comparison views, the first date or location displays in blue; the second displays in orange.
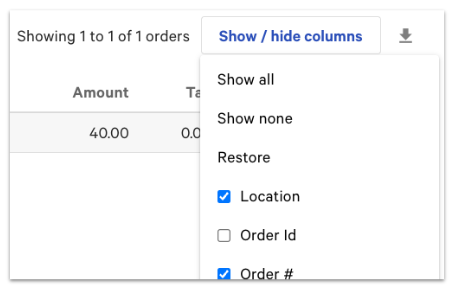
Customize report columns
Many reports let you add or remove data columns before viewing or exporting.
- Select Show/hide columns at the top right of the report table.
- Choose the columns to display. The report updates in real time.
- To reset to the default view, select Restore.
Column changes apply to both the on-screen view and any downloaded or exported file.
For step-by-step instructions on filtering column data before export, see Filter reporting exports.
Export and download reports
Toast provides three ways to save or share report data. Not all reports support every export method — if you do not see an export button described below, that report cannot be exported in that format.
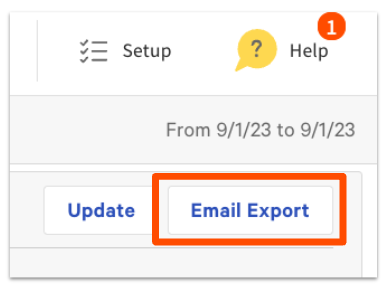
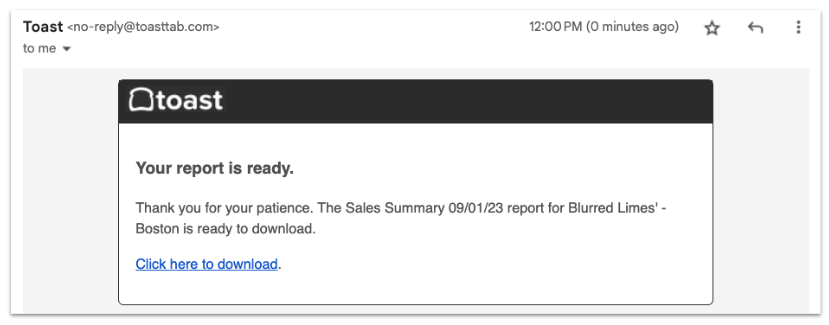
Email export
For reports that support email delivery, select Email Export in the top right corner of the report. Enter one or more email addresses separated by commas, then select Submit. Recipients receive a download link; the file format is .xls or .csv, depending on the report.
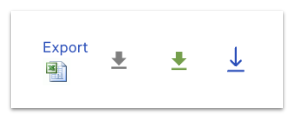
Download
For reports with a download icon (down arrow) in the top right corner, select the icon to download the file directly. Downloaded files open in Excel or can be imported into accounting software.
Print to PDF
Any report can be saved as a PDF using your browser's print function. Toast recommends Google Chrome.
- Select File > Print.
- Set the Destination to Save as PDF, then select Save.
Note: If the print preview shows the report cut off, select More Settings, set Scale to Custom, and enter 49 (or adjust lower until the full report is visible in the preview). Select Save.
Known limitations
- Year-over-year comparisons may time out. Comparing multiple locations across a wide date range in Sales Analytics can cause the report to time out or display an error. Narrow the date range or reduce the number of locations selected, then try again. If the issue continues, contact Toast Customer Care.
- Not all reports can be exported. If neither Email Export nor a download icon is present on a report, that report does not support those export formats. Filtered column exports are also not available for Cash Drawer History, Voided Orders, and No Sale reports.
- Compare Dates uses fixed comparison periods only. The Compare Dates filter compares your selected range to the same period in the prior year or the immediately prior period. Comparing arbitrary date ranges — for example, Easter weekend one year vs. Easter weekend the next — is not supported in this view.
- Some report categories require add-on modules. Kitchen Operations reports require the KDS. Marketing reports require Toast Loyalty or digital receipt enrollment. If a report category is missing from your navigation, confirm the relevant module is active on your account.
Related articles
- Reporting Best Practices: Your First Day on Toast
- Reporting Best Practices: Weekly, Monthly, Quarterly & Yearly
- Filter reporting exports
- Update first day of the week for reporting
- Toast Data Exports Overview