Reporting Best Practices: Your First Day on Toast
Last updated: Apr 30, 2026, 4:20 PM
- What this applies to
- About Toast Web reporting
- Sales reports
- Labor reports
- Cash management and deposit reports
- Reporting tools
- Related articles
What this applies to
New Toast restaurants monitoring daily performance after going live. All reports described in this guide are available in Toast Web under Reports.
Note: Report visibility is controlled by employee roles and permissions. If you cannot access a report listed here, see Why can't I access a report in Toast Web?.
About Toast Web reporting
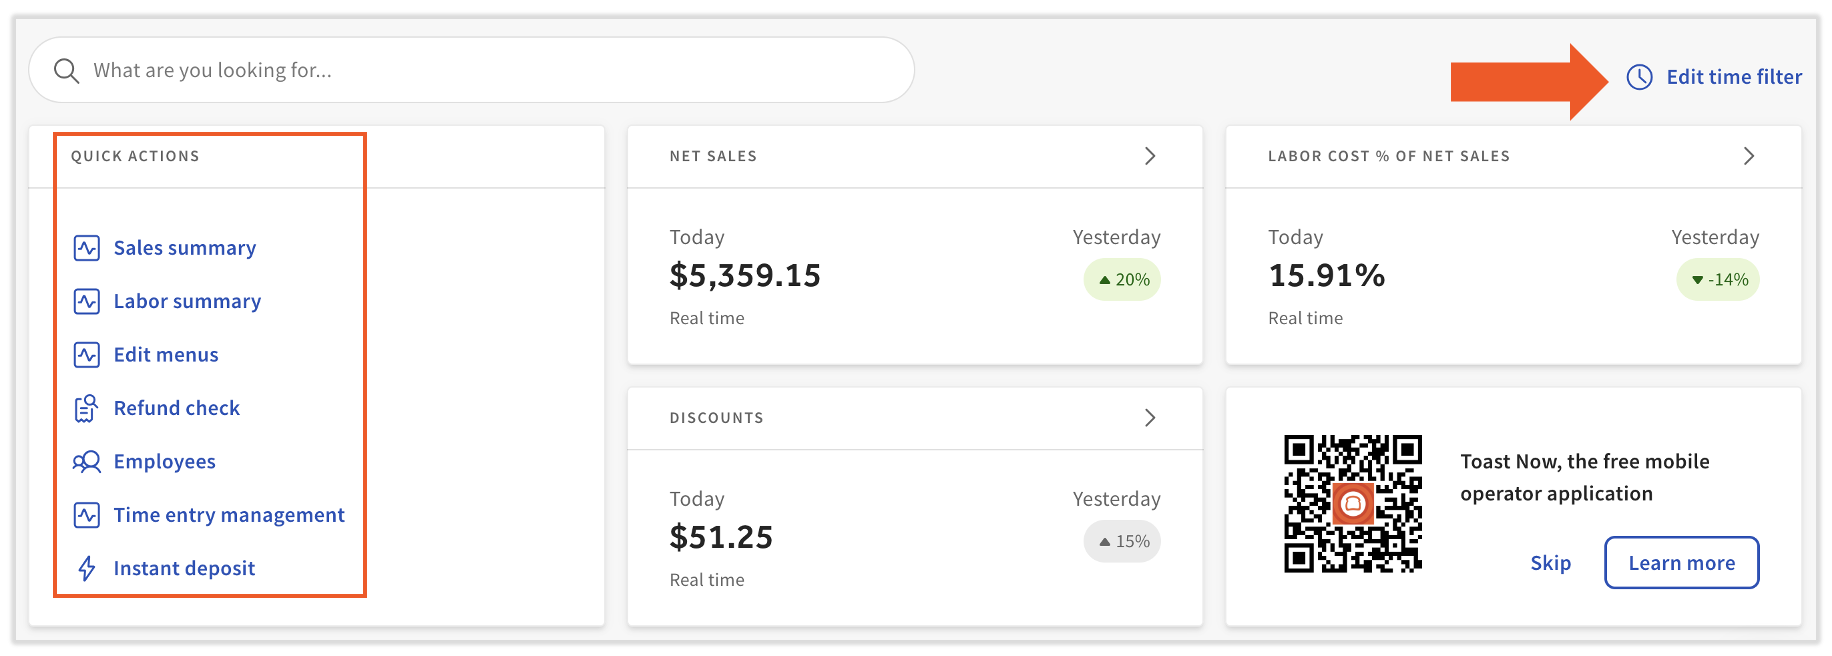
The Toast Web homepage provides a real-time snapshot of key metrics — net sales, hourly labor cost percentage, and discounts — without navigating to a specific report.
Select Edit time filter to toggle the dashboard between today and yesterday.
Select the Compared to option to benchmark against the previous day, same day last week, or same day last year. Red and green indicators show growth or decline relative to the period selected.
Under Quick Actions on the homepage, select Sales summary or Labor summary to jump directly to those reports. You can also refund checks, edit menus, manage employees, and review time entries from Quick Actions.
Note: To receive a daily performance summary by email, see Create email lists and configure employee notifications.
Sales reports
The reports below cover daily sales totals, channel and category breakdowns, and item-level performance data.
| Report | What it shows | Key uses | How to access |
|---|---|---|---|
| Sales Summary | A complete financial snapshot for a selected date range, organized into 17 sections called Sales Summary Cards. Covers revenue, cash, tips, payments, voids, discounts, taxes, dining option totals, and more. Select the gear icon at the top to reorder the cards. | Daily close review; cash and deposit reconciliation; discount and void monitoring; comparing performance day over day. | In Toast Web, navigate to Reports > Sales > Sales summary, or select Sales summary from Quick Actions on the homepage. Use the Date, Location, and More filters options to refine the report. See Sales Summary Report Overview. |
| Sales Breakdown | A side-by-side comparison of two sales metrics from a drop-down list that includes sales category, dining option, revenue center, discount name, server, item name, service area, service type, and sale date. | Viewing sales by channel (dine-in, takeout, online ordering, third-party delivery); identifying menu items or groups missing a sales category assignment; comparing performance by server or revenue center. | In Toast Web, navigate to Reports > Sales > Sales breakdown. Select the date range and use the drop-down menus to configure the two metrics to compare. |
| Product Mix (PMIX) | Item-level sales data showing quantity sold, net sales, and sales percentage per menu item or modifier for the selected date range. Previously called "Menu Breakdown" in older versions of Toast. | Identifying top-selling items; viewing a full breakdown of sales by individual menu item or menu group; understanding modifier performance. | In Toast Web, navigate to Reports > Menu > Product mix. See Product Mix (PMIX) Report Overview. |
Labor reports
The reports below track employee time entries, shift status, and labor cost as a percentage of net sales.
| Report | What it shows | Key uses | How to access |
|---|---|---|---|
| Time Entry Management | All employee clock-in and clock-out records for the selected date range. Supports adding and editing time entries directly from the report. | Verifying time entries daily to keep labor percentage accurate; identifying employees who did not clock out; correcting missing or incorrect entries before payroll. | In Toast Web, navigate to Reports > Labor > Time entry management. Apply the location, date, and employee filters at the top to see all entries for the day. To find employees who were auto-clocked out, go to the Columns section and toggle on Auto clock-out.
|
| Shifts | A summary of all open and closed shifts for the selected date range, including shift review completion status. | Confirming all shifts are closed at end of day; identifying incomplete shift reviews that may cause incorrect deposit amounts or cash totals. You can also mark Cash Collected and Tips paid for any of the employees that day via this report. | In Toast Web, navigate to Reports > Labor > Shifts. Select Today at the top to view all shifts for the current day. See Shift Review Overview. |
Cash management and deposit reports
The reports below support daily cash reconciliation and deposit verification.
| Report | What it shows | Key uses | How to access |
|---|---|---|---|
| Sales Summary — Cash Summary card | Total cash collected for the day and the expected deposit amount, drawn from the cash drawer report. Select the (i) icon next to any row for a description of that line item. | Daily cash reconciliation; verifying expected deposit total before end of day. | In Toast Web, navigate to Reports > Sales > Sales summary, or select Sales summary from Quick Actions. Locate the Cash Summary and Cash Activity Summary cards. |
| Drawer History | An overview of all cash activity for the restaurant, organized by individual cash drawer and house totals. | Monitoring each cash drawer separately; reconciling house cash totals against the daily deposit; verifying that individual drawer totals match expected amounts. | In Toast Web, navigate to Reports > Cash and loss management > Drawer history. |
| Deposit Totals Overview | Settled and pending credit card batches. The Settled Deposits Daily Breakdown report is also available and shows only settled deposits. | Reconciling bank account deposits against settled credit card batches; tracking pending batches not yet settled. It also shows the processing fees for the different card providers. | In Toast Web, navigate to Reports > Payments > Deposit totals overview. |
Note: Cash drawer history can only be viewed one day at a time. To reconcile cash across a date range, use the Sales Summary Cash Summary card in combination with the Deposit Totals Overview.
Reporting tools
Compare multiple locations
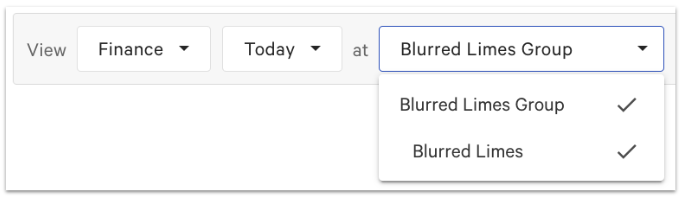
If you manage multiple locations, most reports include a Location filter at the top that allows you to select more than one location and view their data side by side.
Filter by dining option or service area
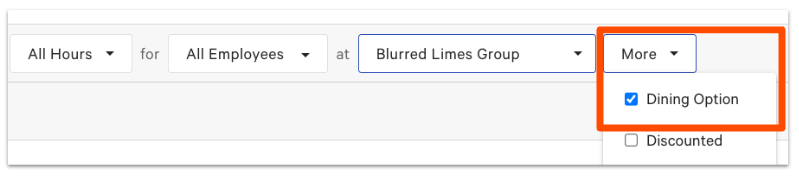
Tracking sales across channels — dine-in, takeout, online ordering, third-party delivery — is available in most reports. Select Dining option under the More drop-down in the report header to break out sales, orders, and totals by channel. Other options, such as service area, are available in the same drop-down.
Export or email a report
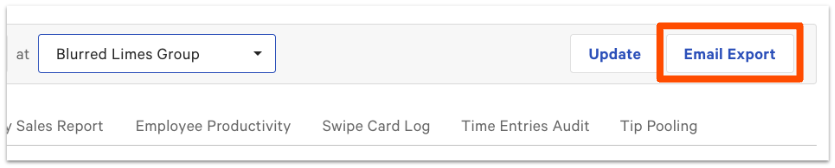
Select the download icon or print icon on any report to export as a PDF, Excel spreadsheet, or CSV file. To send the report by email, select Email export.
Related articles
- Get started with analytics and reports
- Sales Reports Overview
- Sales Summary Report Overview
- Product Mix (PMIX) Report Overview
- Menu Reports Overview
- Labor Reports Overview
- Edit Employee Time Clock Entries
- Shift Review Overview
- Why can't I access a report in Toast Web?
- Create email lists and configure employee notifications