xtraCHEF: COGS Report
Last updated: Jul 13, 2026, 12:42 PM
- What is COGS Reporting?
- COGS Report Setup Steps
- New COGS Report Walkthrough
- Identify Unmapped Items in the COGS Report
- Interpret your COGS Report
What is COGS Reporting?
In accounting, your Cost of Goods is the sum of all expenses that comprise the sales of your menu items. This sum can be calculated by using the formula:
Beginning Inventory + Purchases - Ending Inventory.
When that Cost of Goods is then compared to your sales (Cost of Goods / Sales), it creates your Cost of Goods Sold (COGS). COGS is an excellent point of reference to evaluate profit margins and the overall health of your restaurant. By taking the configuration steps listed in this article, xtraCHEF will be configured to present this data to you in your COGS tab.
COGS Report Setup Steps
Add Accounting Periods
Before you can begin creating a COGS report within xtraCHEF, you must first configure an accounting period for each location. In the bookkeeping world, an accounting period refers to the time in which financial records are created. You can base your accounting period on the calendar year or follow your organization's fiscal year if you have one.
To learn how to add an accounting period in xtraCHEF, consider reading xtraCHEF: Add New Accounting Period.
Map COGS
Mapping COGS in xtraCHEF allows for more comprehensive food cost reporting and should be completed for sales and categories. To sync sales from Toast into xtraCHEF and to get a COGS report, sales and categories must be mapped to COGS.
To learn how to map your COGS in xtraCHEF, check out xtraCHEF: COGS Mapping or watch the video tutorial.
Sync Monitor: Add Closing Inventory
Without adding inventory values to your Sync Monitor, the COGS report would only include purchases and sales. For this reason, an inventory value must be entered in your Sync Monitor on the final day of your accounting period in order for COGS reporting to populate (you can also add additional inventory entries on other days if you like). There are two ways to do this:
- You can automatically post your Inventory by COGS report numbers to the Sync Monitor by navigating to Reporting > Inventory > Inventory by COGS.
- Select an inventory date, the area(s), and count list(s). Then select Submit.
- Once the report is generated, select Post to Sync Monitor.
- You can also do this manually.
- Begin by navigating to Sync Monitor.
- Select the Action drop-down menu and choose Closing Inventory.
- After picking a date, input your closing inventory values. Save once complete.
Visit xtraCHEF: Sync Monitor for more detailed instructions on this step.
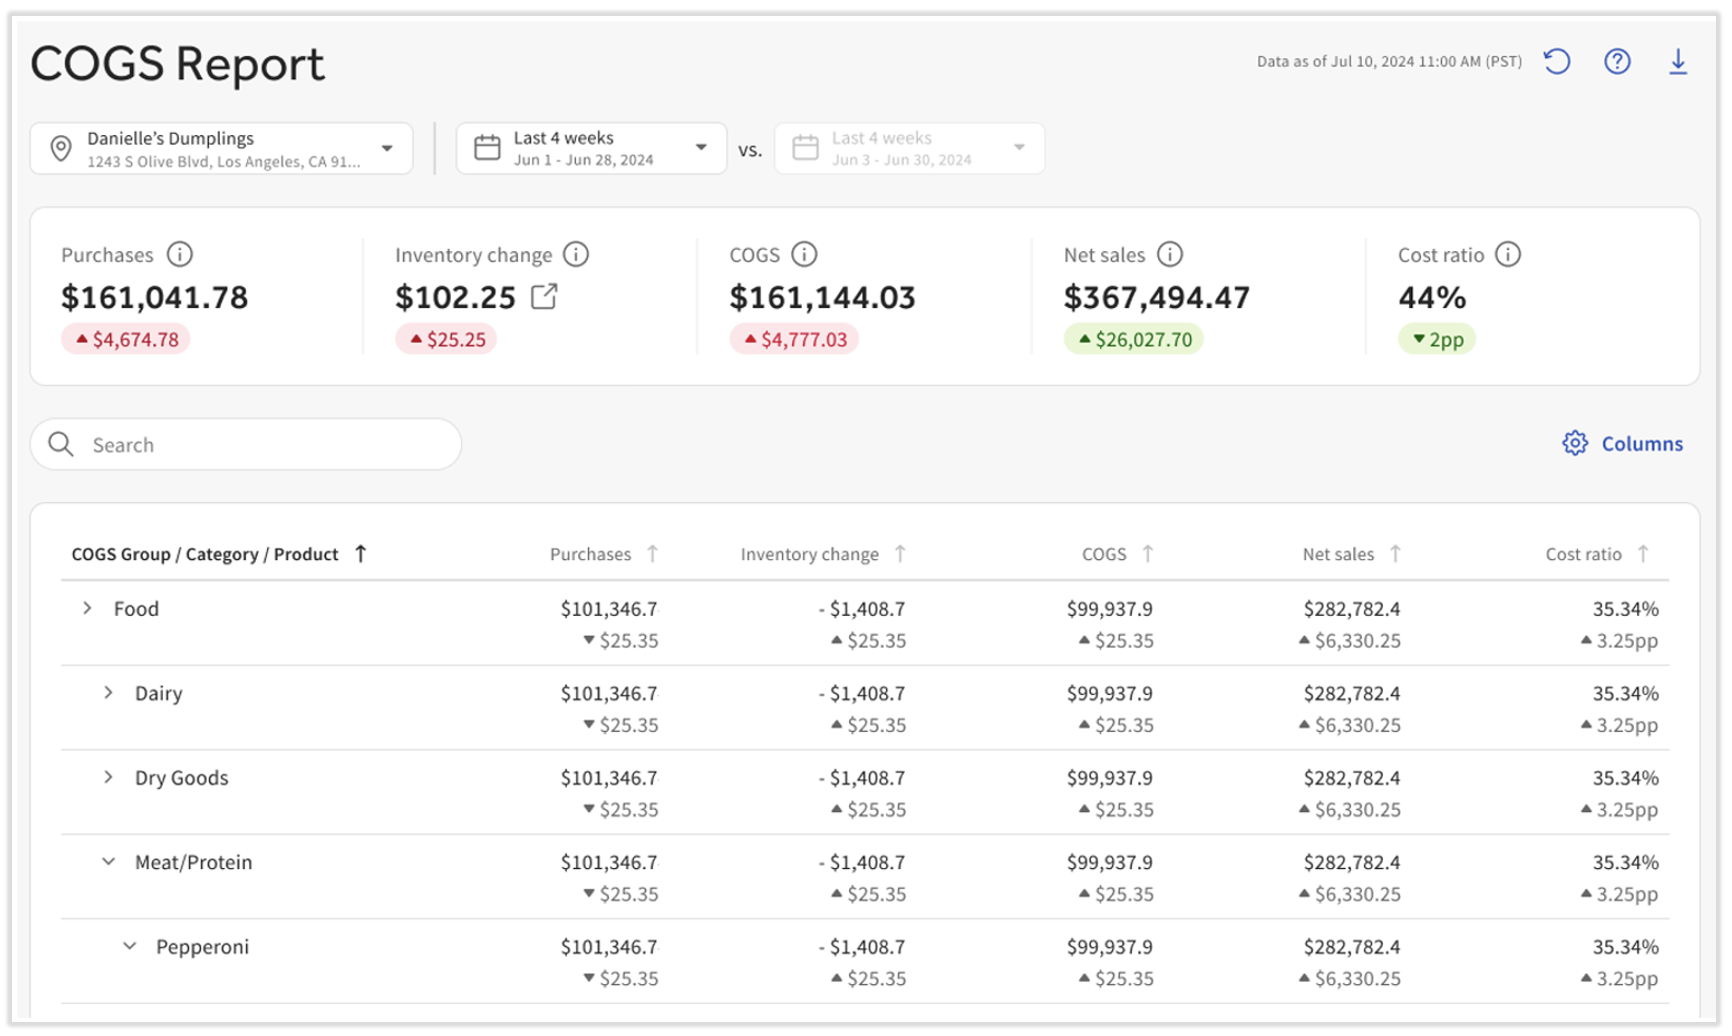
New COGS Report Walkthrough
- Select COGS from the left-hand navigation menu.
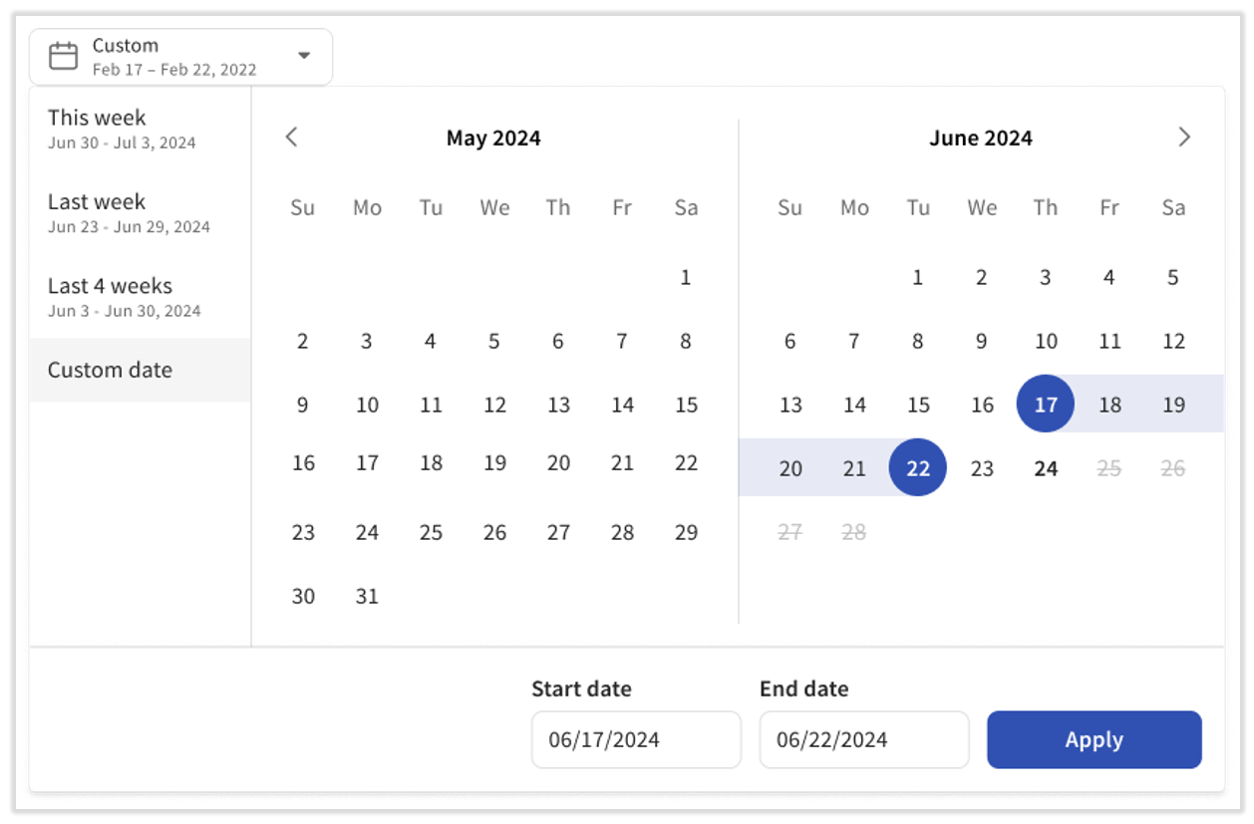
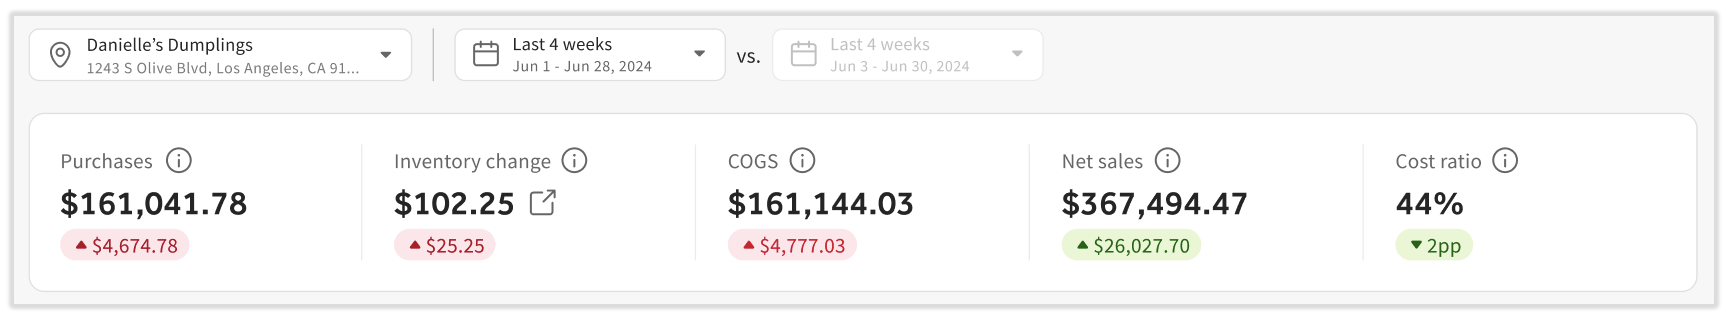
- Select a Location (you no longer need to select a date range based on accounting periods). xtraCHEF set up a custom date range picker along with commonly-used date ranges.
- Just like on the xtraCHEF dashboard, the second date range is not editable; it simply provides a period to compare against. For instance, let's say you selected the Last 4 weeks in the first date picker. The second one will automatically update to the four weeks prior to the four weeks originally selected. This way, the tiles below the date pickers (Purchases, Inventory change, etc.) have something to compare against and give you the green or red change values.
- The Inventory change value will be locked (blank) if you have xtraCHEF Essentials.
- The Inventory change value will be locked (blank) if you have xtraCHEF Essentials.
- Next, the Columns button on the right allows you to view more data than we initially present. Select this to add things like Gross Sales and the report will update automatically.
- Each column can be sorted if you select its name at the top. This makes it easier to see top drivers of each metric.
- In order to contextualize the impact that individual products have on your catalog, we have added in a calculation for the % of net sales connected to each category and product. The net sales for each product is derived from the total net sales of every menu item that uses that product in its recipe.
Note: The COGS Net Sales column is derived from the Toast Sales Summary. In the dropdown, Net Sales reflect Recipe Mapping. "Unmapped" represents the difference between these two. Note: Net Sales values are estimates for directional insight rather than 1:1 accounting matches.
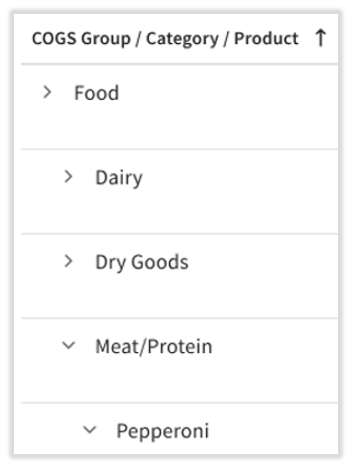
- Another new feature is the > carat icons which allows users to drill down into each COGS group, category, product, and even invoice item. Selecting these allows you to view everything underneath it.
- We recommend using the search bar to quickly find what you're looking for. This can prevent several open > menus.
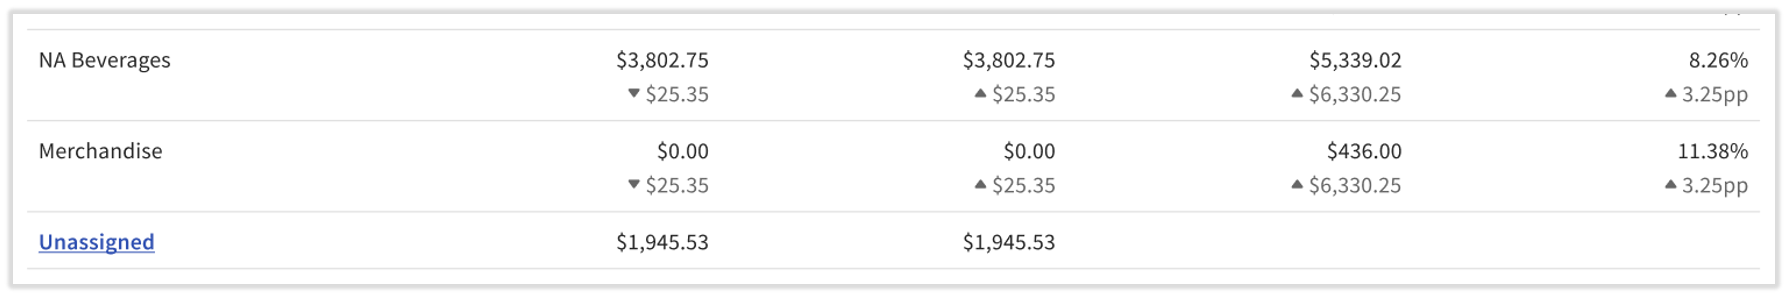
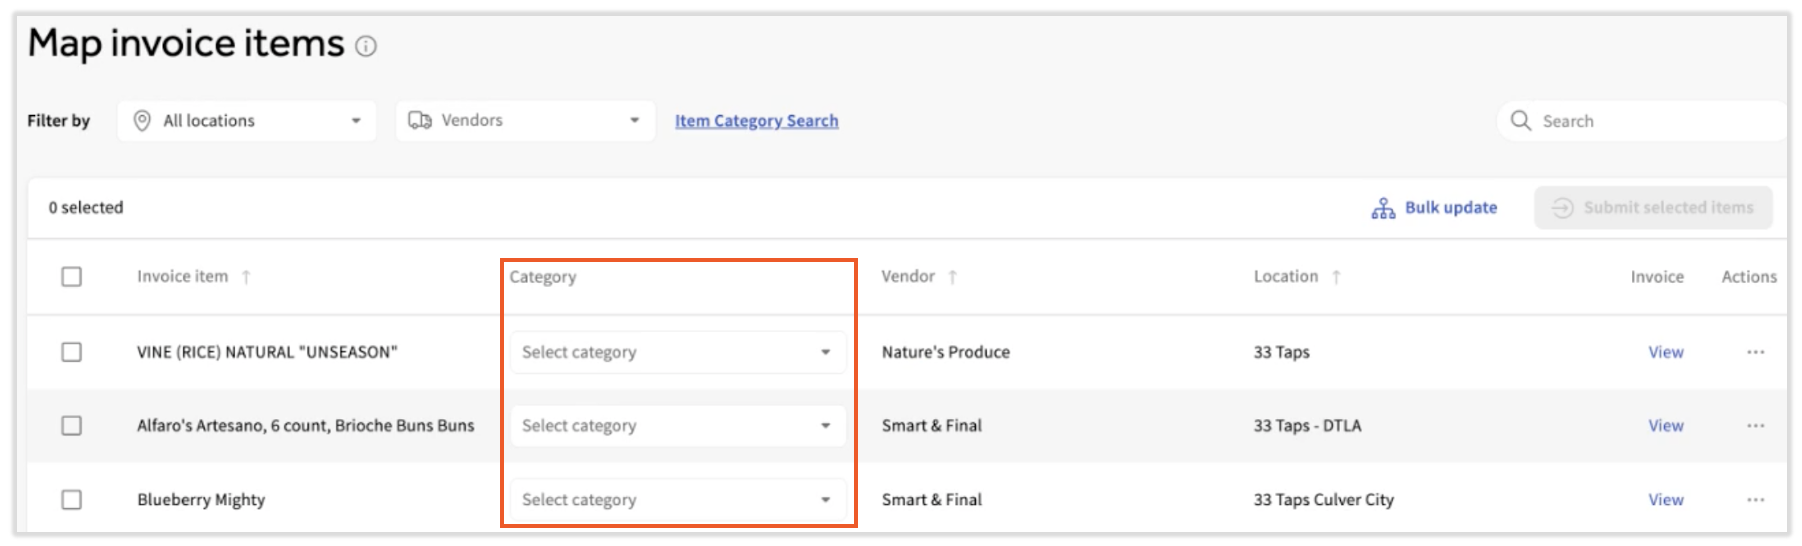
Identify Unassigned Items in the COGS Report
To identify unassigned items in the COGS report, review these steps:
- Select COGS from the left-hand navigation menu.
- At the bottom of the report, you'll see an Unassigned link if you have any unmapped items on this report. If you do not see this link, all purchased items in the selected date range are assigned to a category.
- In the past, any invoice items which were not assigned to a category would not appear on or have an impact on this report.
- In the past, any invoice items which were not assigned to a category would not appear on or have an impact on this report.
- Selecting that link will pull up all unassigned invoice items (the Map invoice items page). This allows users to quickly update the categories for these invoice items.
- Once each unassigned item is assigned to a category, the Unassigned hyperlink will disappear and all invoice items will be contributing to the COGS report.
Items Unmapped to Recipes
In this report, we pull in the full amount of sales reported from your Toast POS. If all of your sales are mapped to the corresponding recipe within xtraCHEF, you can see how those sales are allocated across your COGS groups and categories. However, in the case that there are excess sales not mapped to recipes, we will display the excess sales as Unmapped.
For example, you have sold $100 worth of Beer: $50 of Corona, $30 of Bud Light and $20 of Budweiser. You created recipes for Corona and Bud Light and mapped them to the Beer category, but did not do the same for Budweiser. In that case, your report would show $20 of Unmapped sales because we don’t have the mapping data available.
Interpret Your COGS Report
Typically, the lower your COGS, the more profitable your business is. The opposite can also be true, as higher COGS indicate room exists for improvement. If you are utilizing xtraCHEF Recipe and Inventory features, you can go a step further and dive into your Product Mix Report to identify specific menu items with unhealthy profit margins or your Actual Vs. Theoretical Report to track where waste may be coming from.
Back to top