Gestión de restaurantes: Informe de resumen de la ubicación
Última actualización: 25 jun 2026, 11:29 a.m.
- Gestión de restaurantes: Introducción al informe de resumen de la ubicación
- Opciones de filtros, visualización y exportación
- Recursos adicionales
Gestión de restaurantes: Introducción al informe de resumen de la ubicación
El informe de resumen de ubicaciones de Toast te permite ver datos clave de rendimiento para todas tus ubicaciones en un formato de tabla clasificable. Compara los datos de ventas, clientes y mano de obra en todas las ubicaciones con opciones sencillas de clasificación, filtrado y exportación.
Este informe de resumen de ubicación está disponible para clientes que tienen las suites Essentials de Gestión de restaurantes, Pro de Gestión de restaurantes o Enterprise de Gestión de restaurantes (más información en Resumen de Suites Toast). Los clientes sin una suite de gestión de restaurantes pueden ver los datos de su ubicación utilizando otros informes en Toast Web. Consulta Primeros pasos con análisis e informes para obtener más información.
Para acceder al informe en Toast Web, ve a Informes > Resumen > Resumen de la ubicación.
Nota: Solo podrás ver datos de las ubicaciones y grupos de ubicaciones para los que tienes permisos de administrador del restaurante.
Volver arriba
Opciones de filtro, visualización y exportación para el informe de resumen de la ubicación
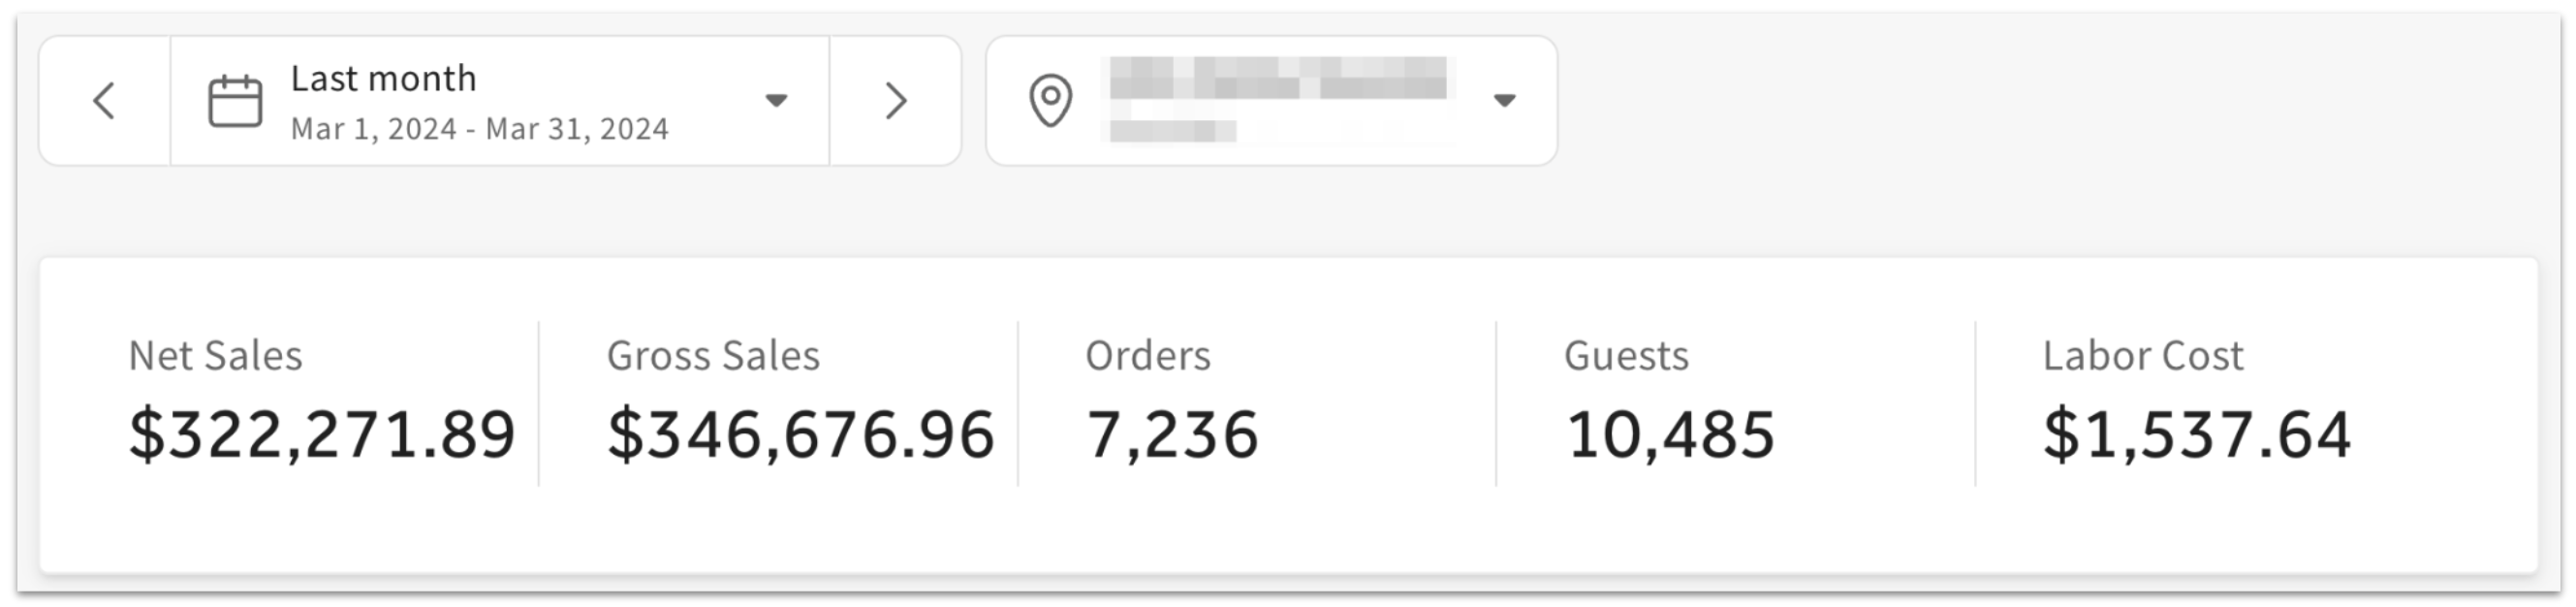
En la parte superior del informe de resumen de la ubicación, verás filtros de fecha y ubicación. Usa el menú desplegable para seleccionar entre diferentes opciones preestablecidas (ayer, hoy, esta semana, etc.), o selecciona Fecha personalizada para elegir un rango específico para tu informe. El menú desplegable de ubicaciones te permitirá seleccionar una o más ubicaciones individuales, o cualquier grupo de ubicaciones que hayas configurado (más información en Crear, ver y editar grupos de ubicaciones). Las ubicaciones y grupos que sean visibles dependerán de tus permisos de acceso.
Una tarjeta de resumen muestra las ventas netas, las ventas brutas, los pedidos, los clientes y el costo laboral de la fecha y las ubicaciones seleccionadas.
Debajo del resumen, verás una tabla con datos desglosados por cada ubicación.
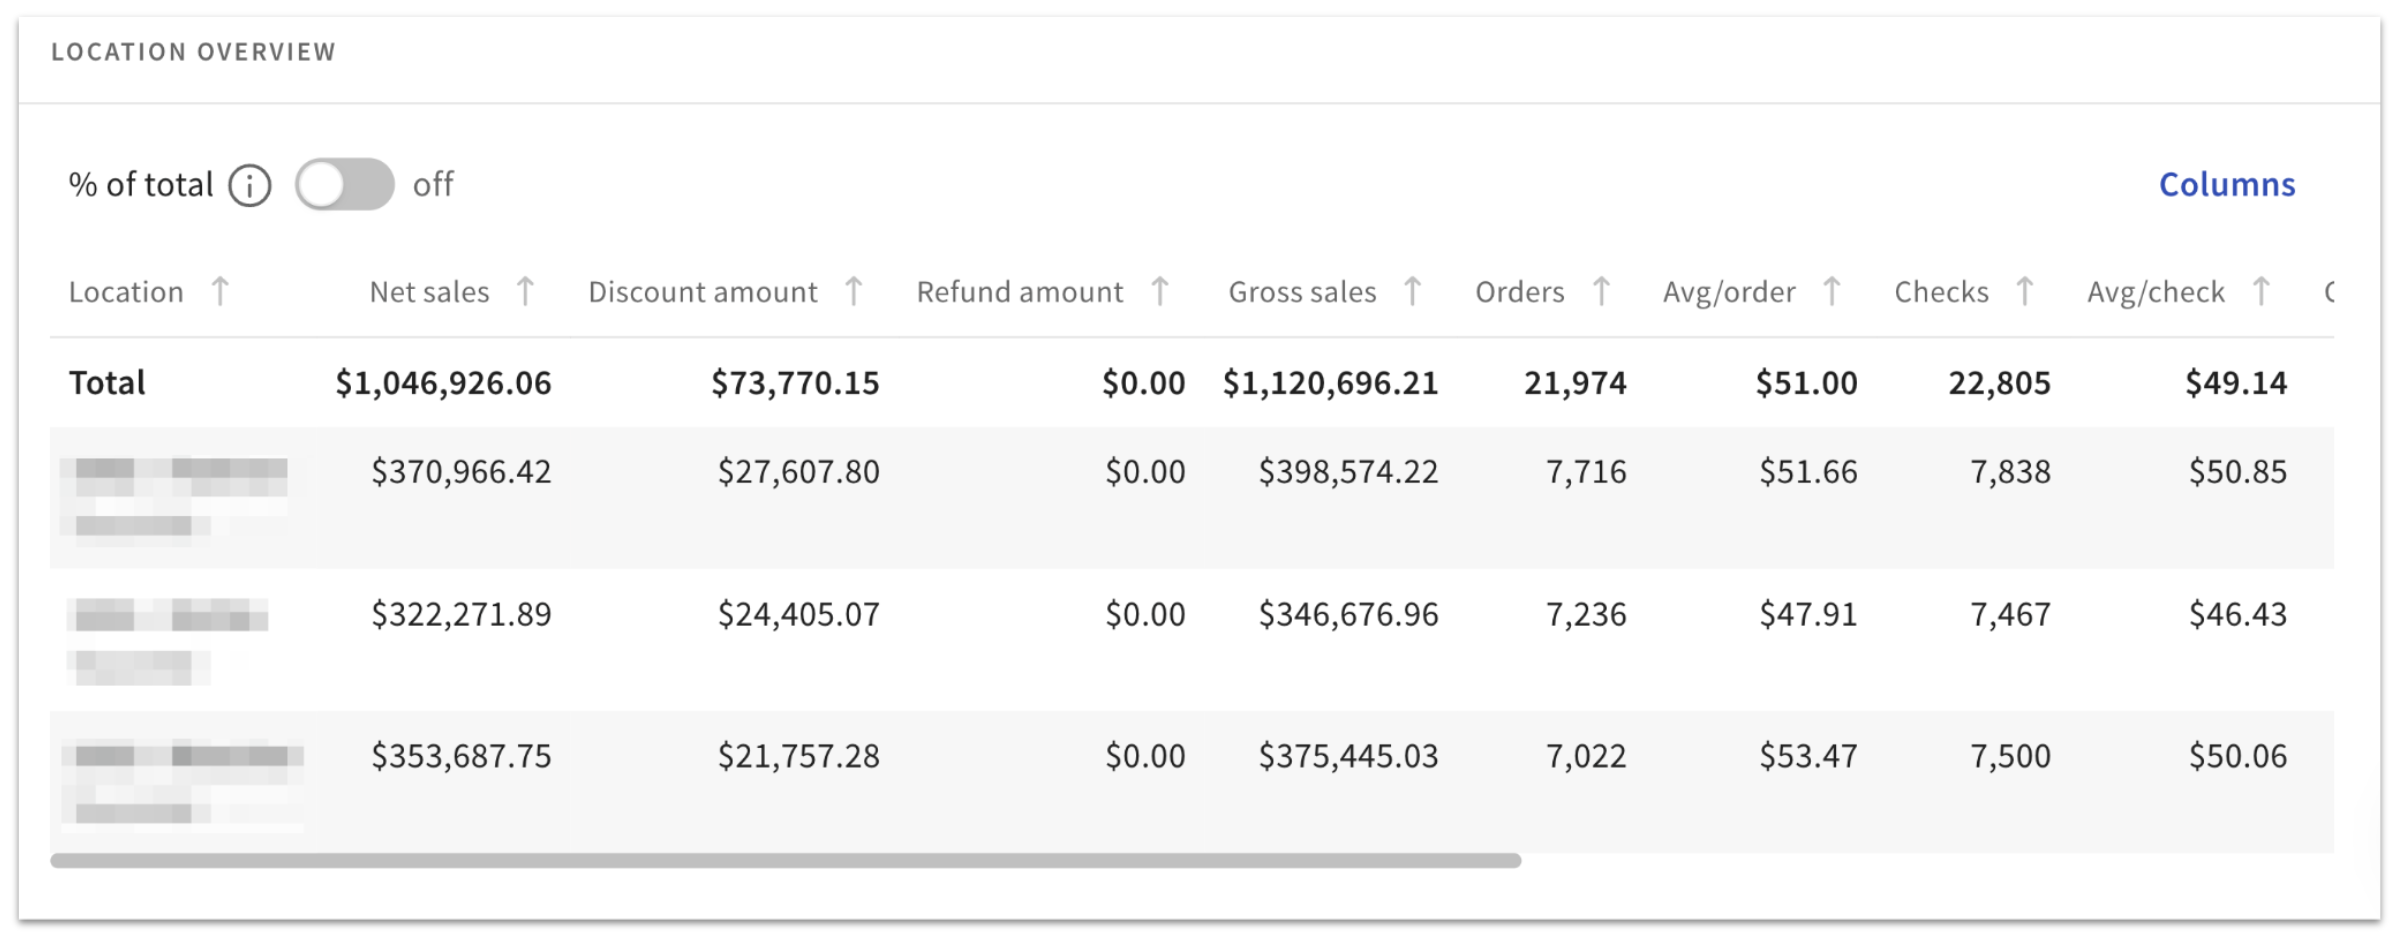
Hay 15 columnas disponibles para la tabla de resumen: ventas netas, monto de descuento, monto de reembolso, ventas brutas, pedido, promedio/pedido, cuentas, promedio/cuenta, clientes, promedio/cliente, # descuentos, costo de mano de obra, SPLH (ventas por hora de trabajo) y porcentaje de mano de obra. Selecciona el botón Columnas en la parte superior derecha para personalizar los datos que aparecen en tu informe. Es posible que debas desplazarte hacia la derecha para ver todas las columnas de la tabla.
El botón % del total en la parte superior izquierda de la tabla agregará un cálculo de “% del total” a las métricas aplicables.
Para exportar el informe de resumen de la ubicación como un archivo CSV o Excel, selecciona el ícono de flecha hacia abajo azul en la esquina superior derecha de la página. Como alternativa, selecciona el ícono de correo electrónico para enviar el informe exportado a la dirección de correo electrónico que prefieras.