xtraCHEF: Variance Analysis and Product Mix Reports
Last updated: Jul 9, 2026, 10:56 AM
Recipe Reporting Summary
Once you've created your Recipes and Prep Recipes and you've completed Product Mix Mapping, xtraCHEF will be able to automatically create advanced recipe-related reporting.
More specifically, by combining your daily sales from Toast and xtraCHEF's ability to track real-time plate costing and variance updates, you can keep track of the health of your menu and spotlight where changes can be made to increase profitability.
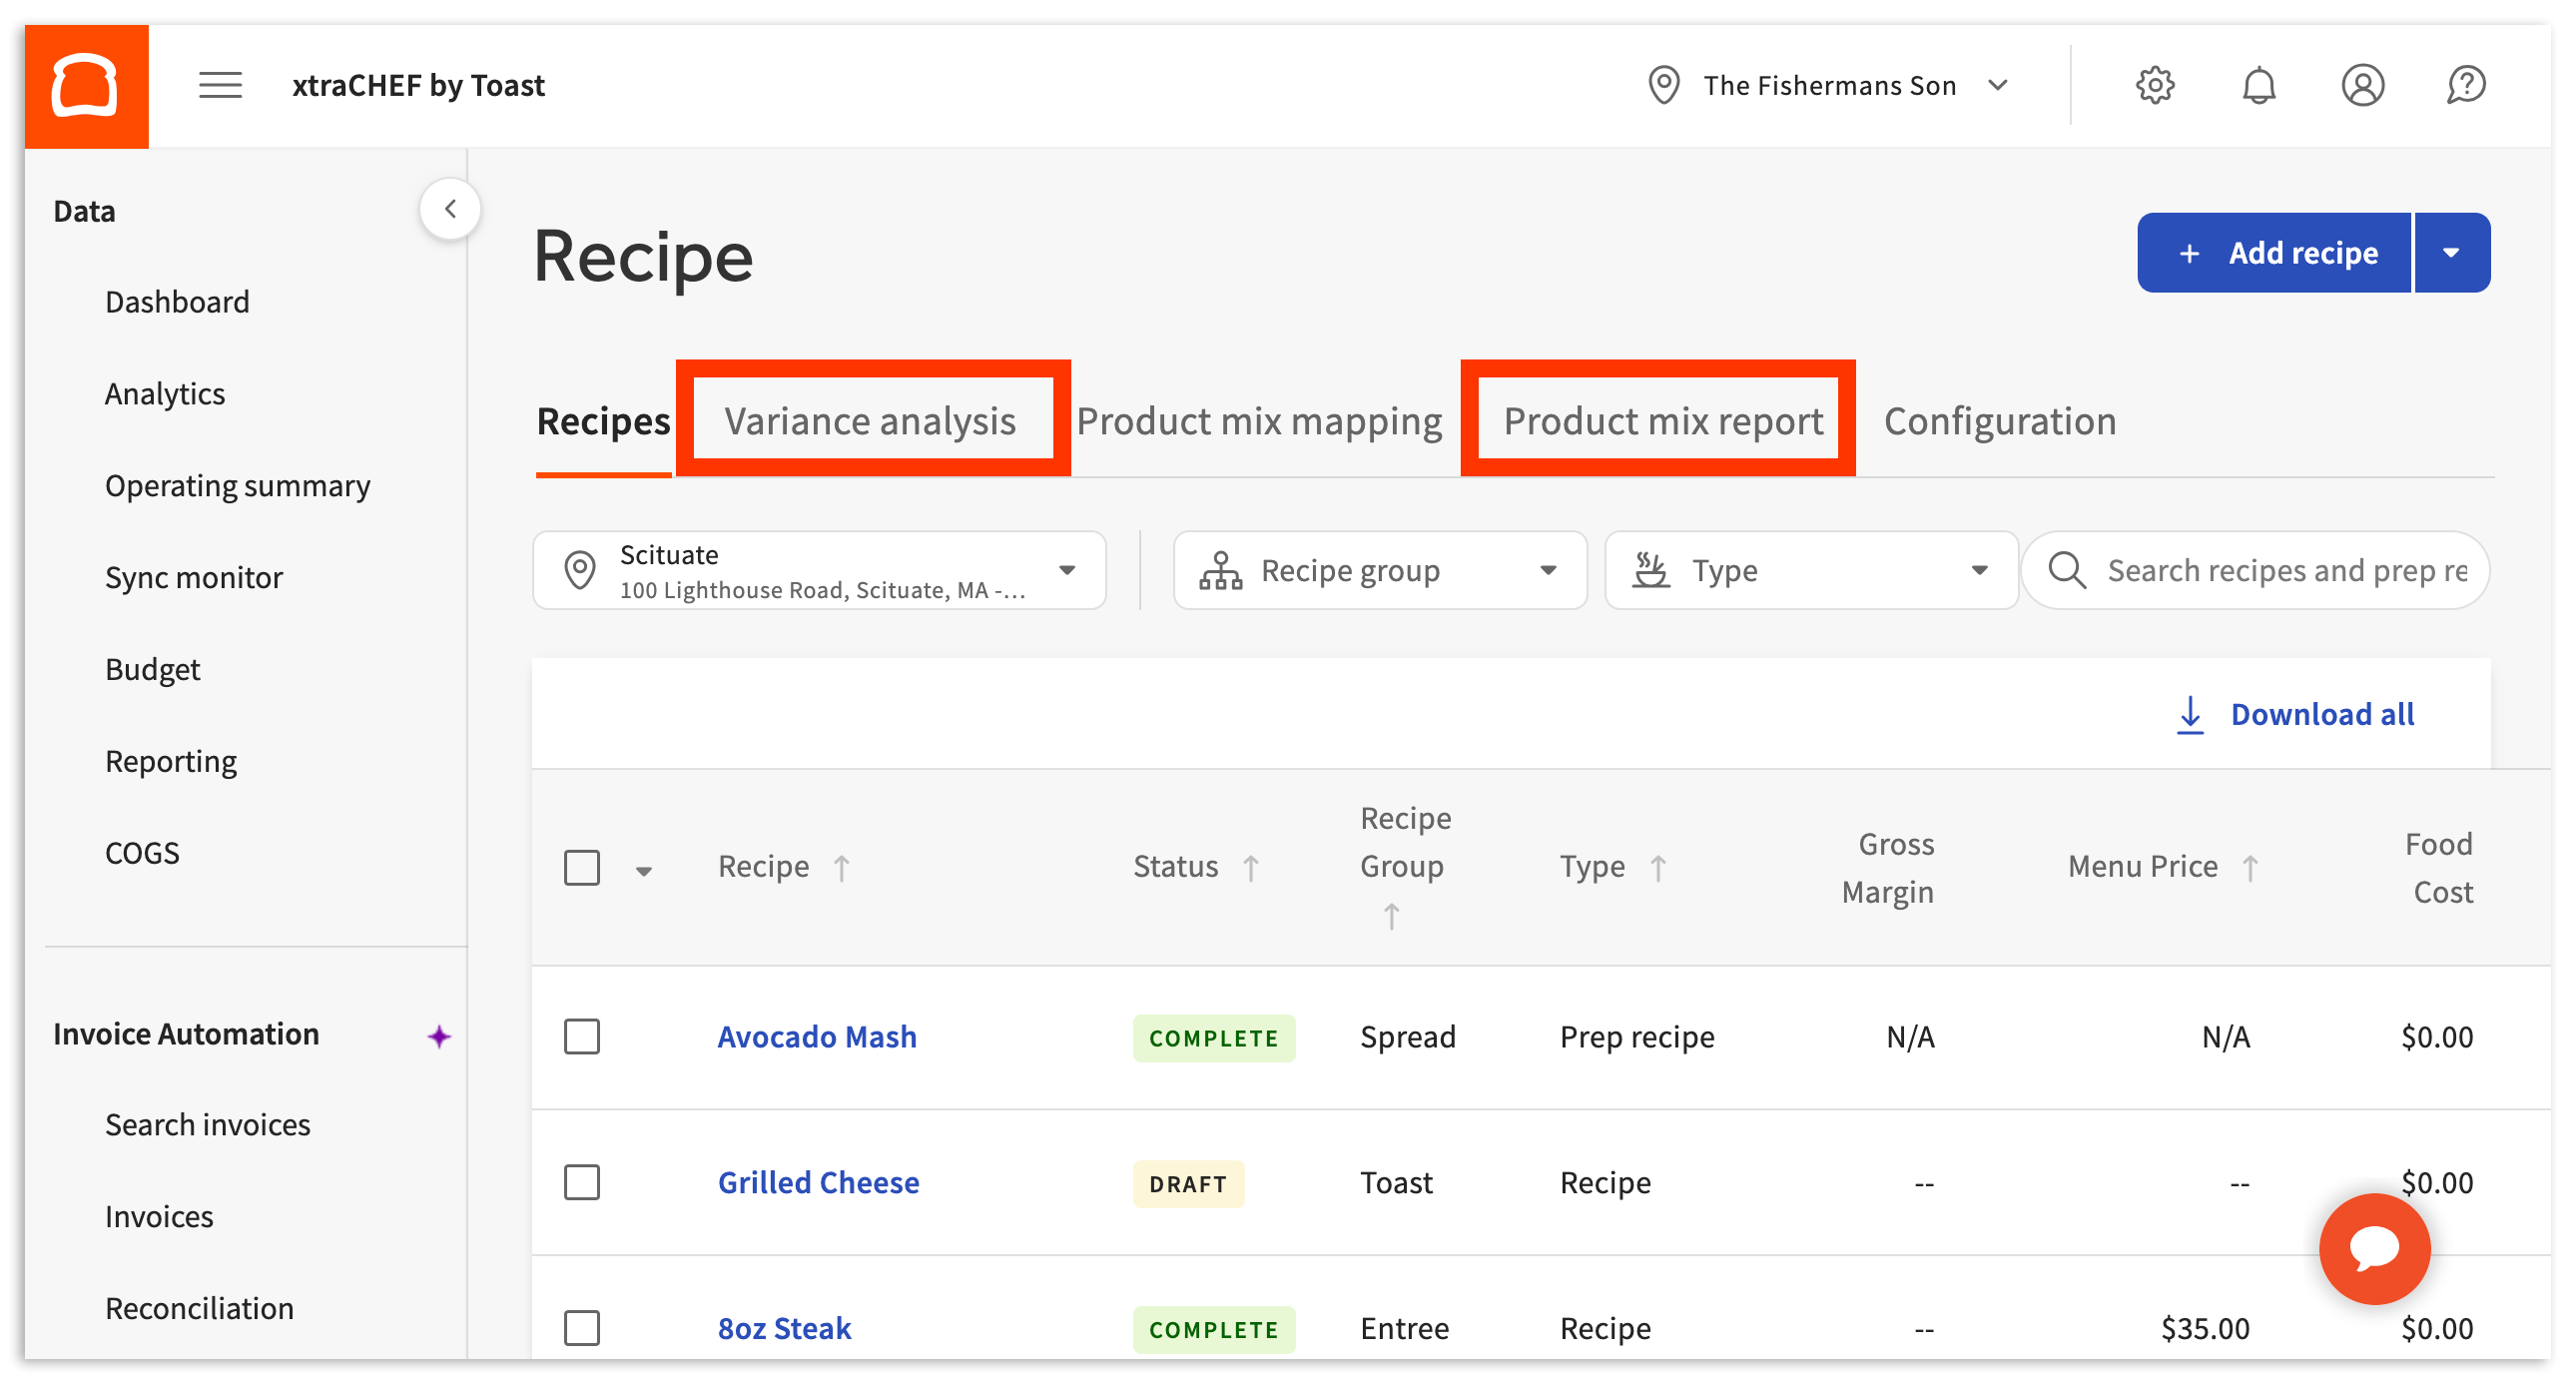
The Variance Analysis and Product Mix Reports can be found by selecting the Recipe tab on your xtraCHEF accounts navigation bar. Then select either Variance Analysis or Product Mix Report (product mix mapping must be completed for this report to populate; map your products as soon as possible because retroactive Product Mix reporting is not possible).
Variance Analysis
The Variance Analysis tab tracks how the cost of your recipe ingredients fluctuates over time. This allows you to have a more holistic view of your pricing strategy and provide data-driven justification for raising prices if needed in the future.
xtraCHEF will automatically track the cost of products you use in your prep recipes and recipes when you scan your invoices. As a result, you can track incremental price changes you may not otherwise have the time to analyze manually.
Variance Analysis Guide
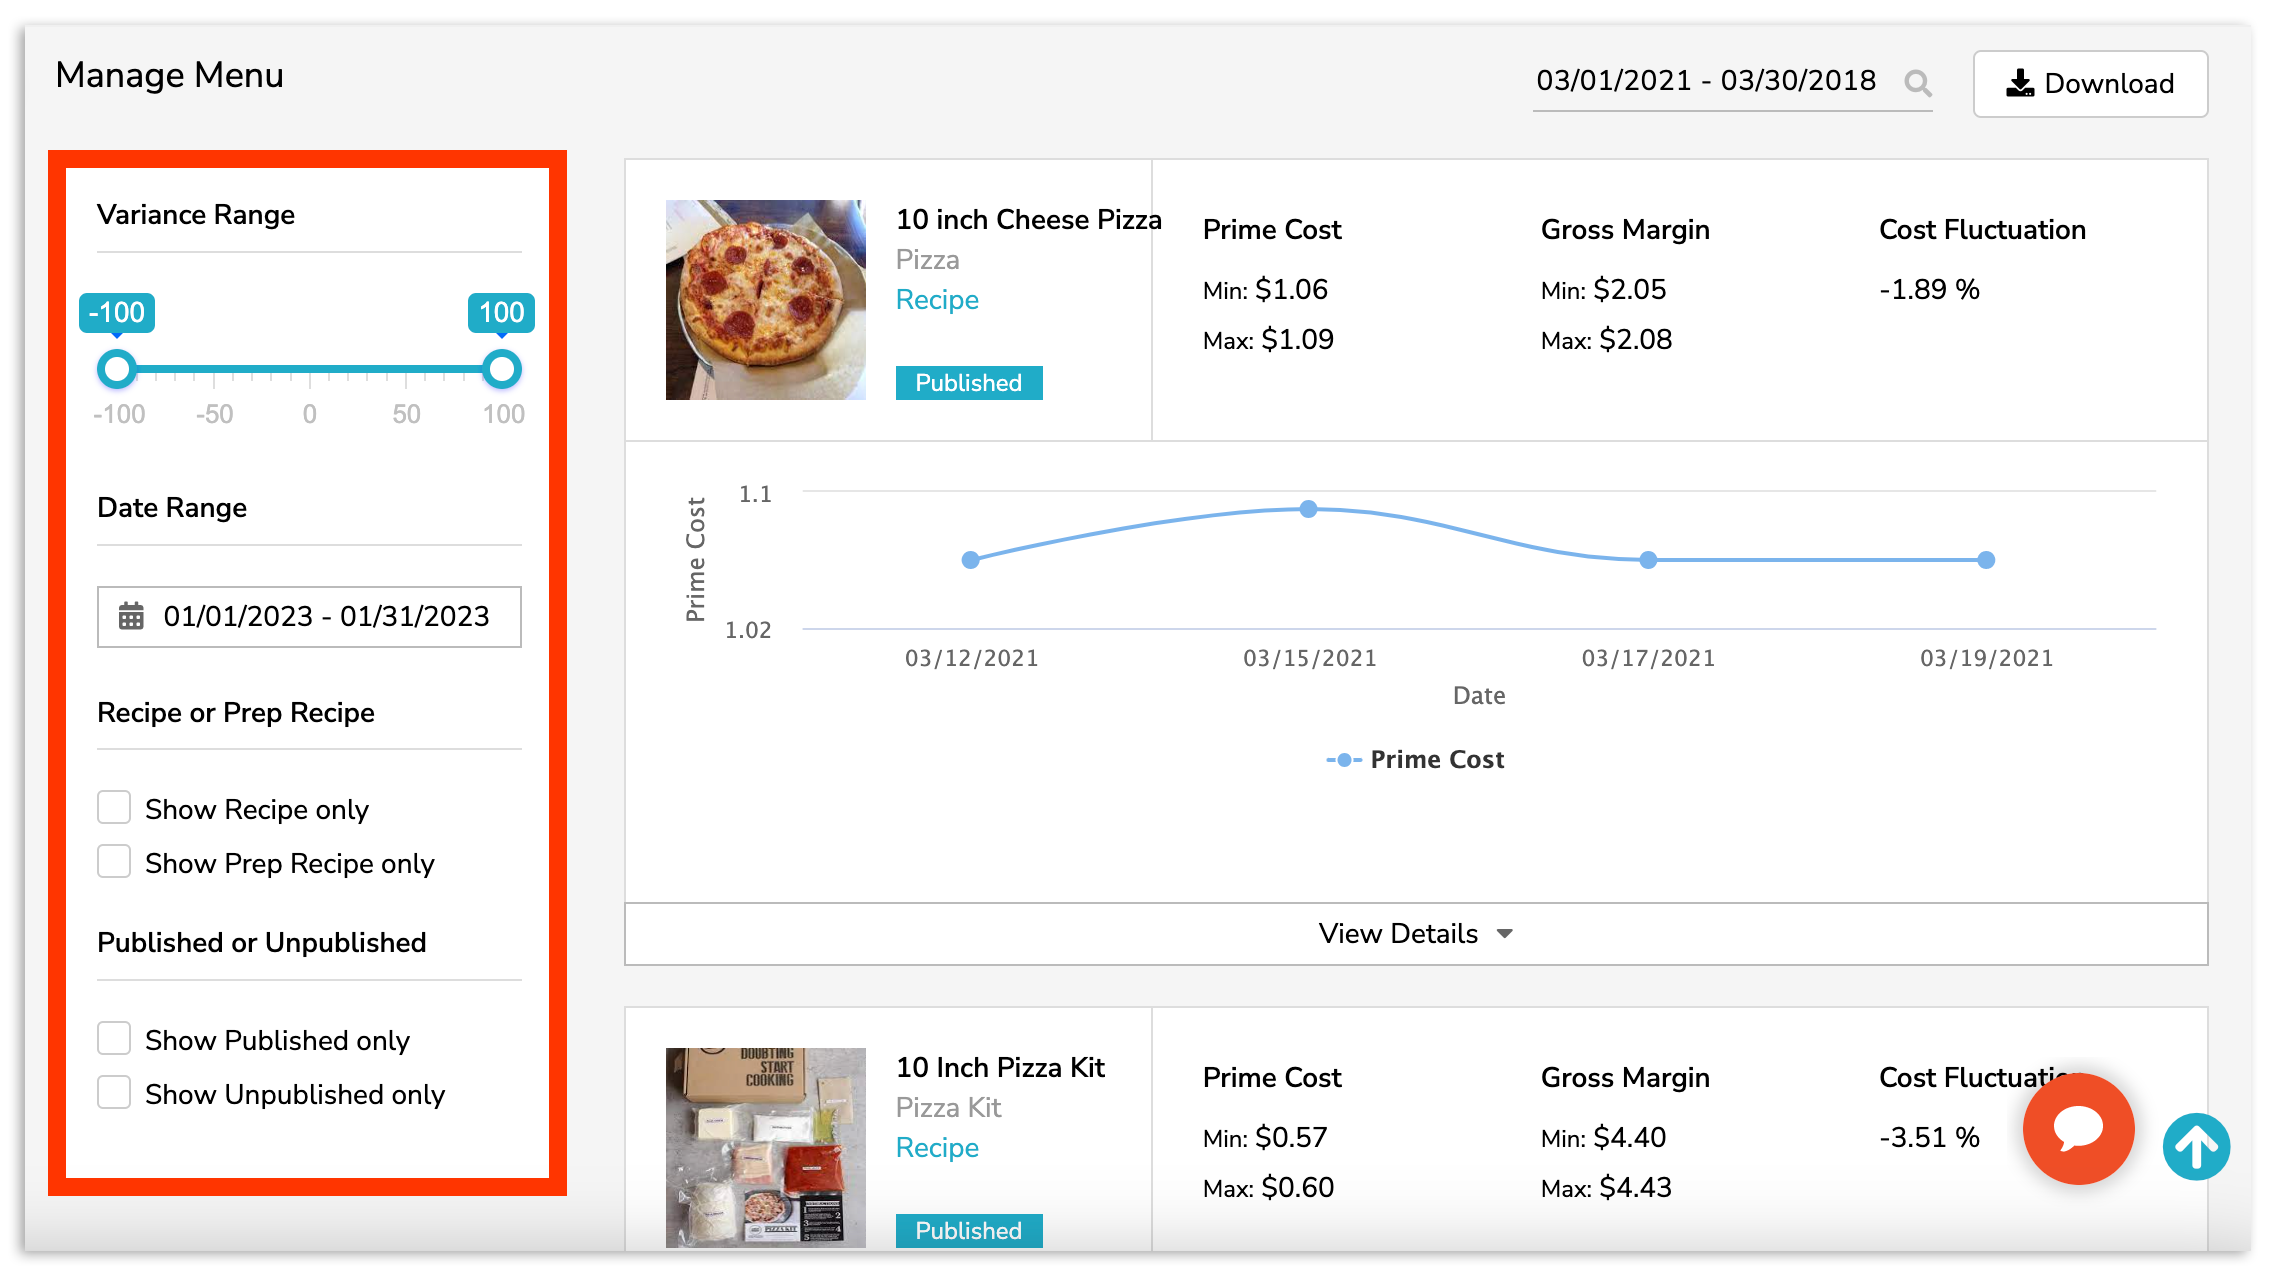
Each of your recipes and prep recipes will be listed by default, but you can use the options on the left side of the page to customize your display results.
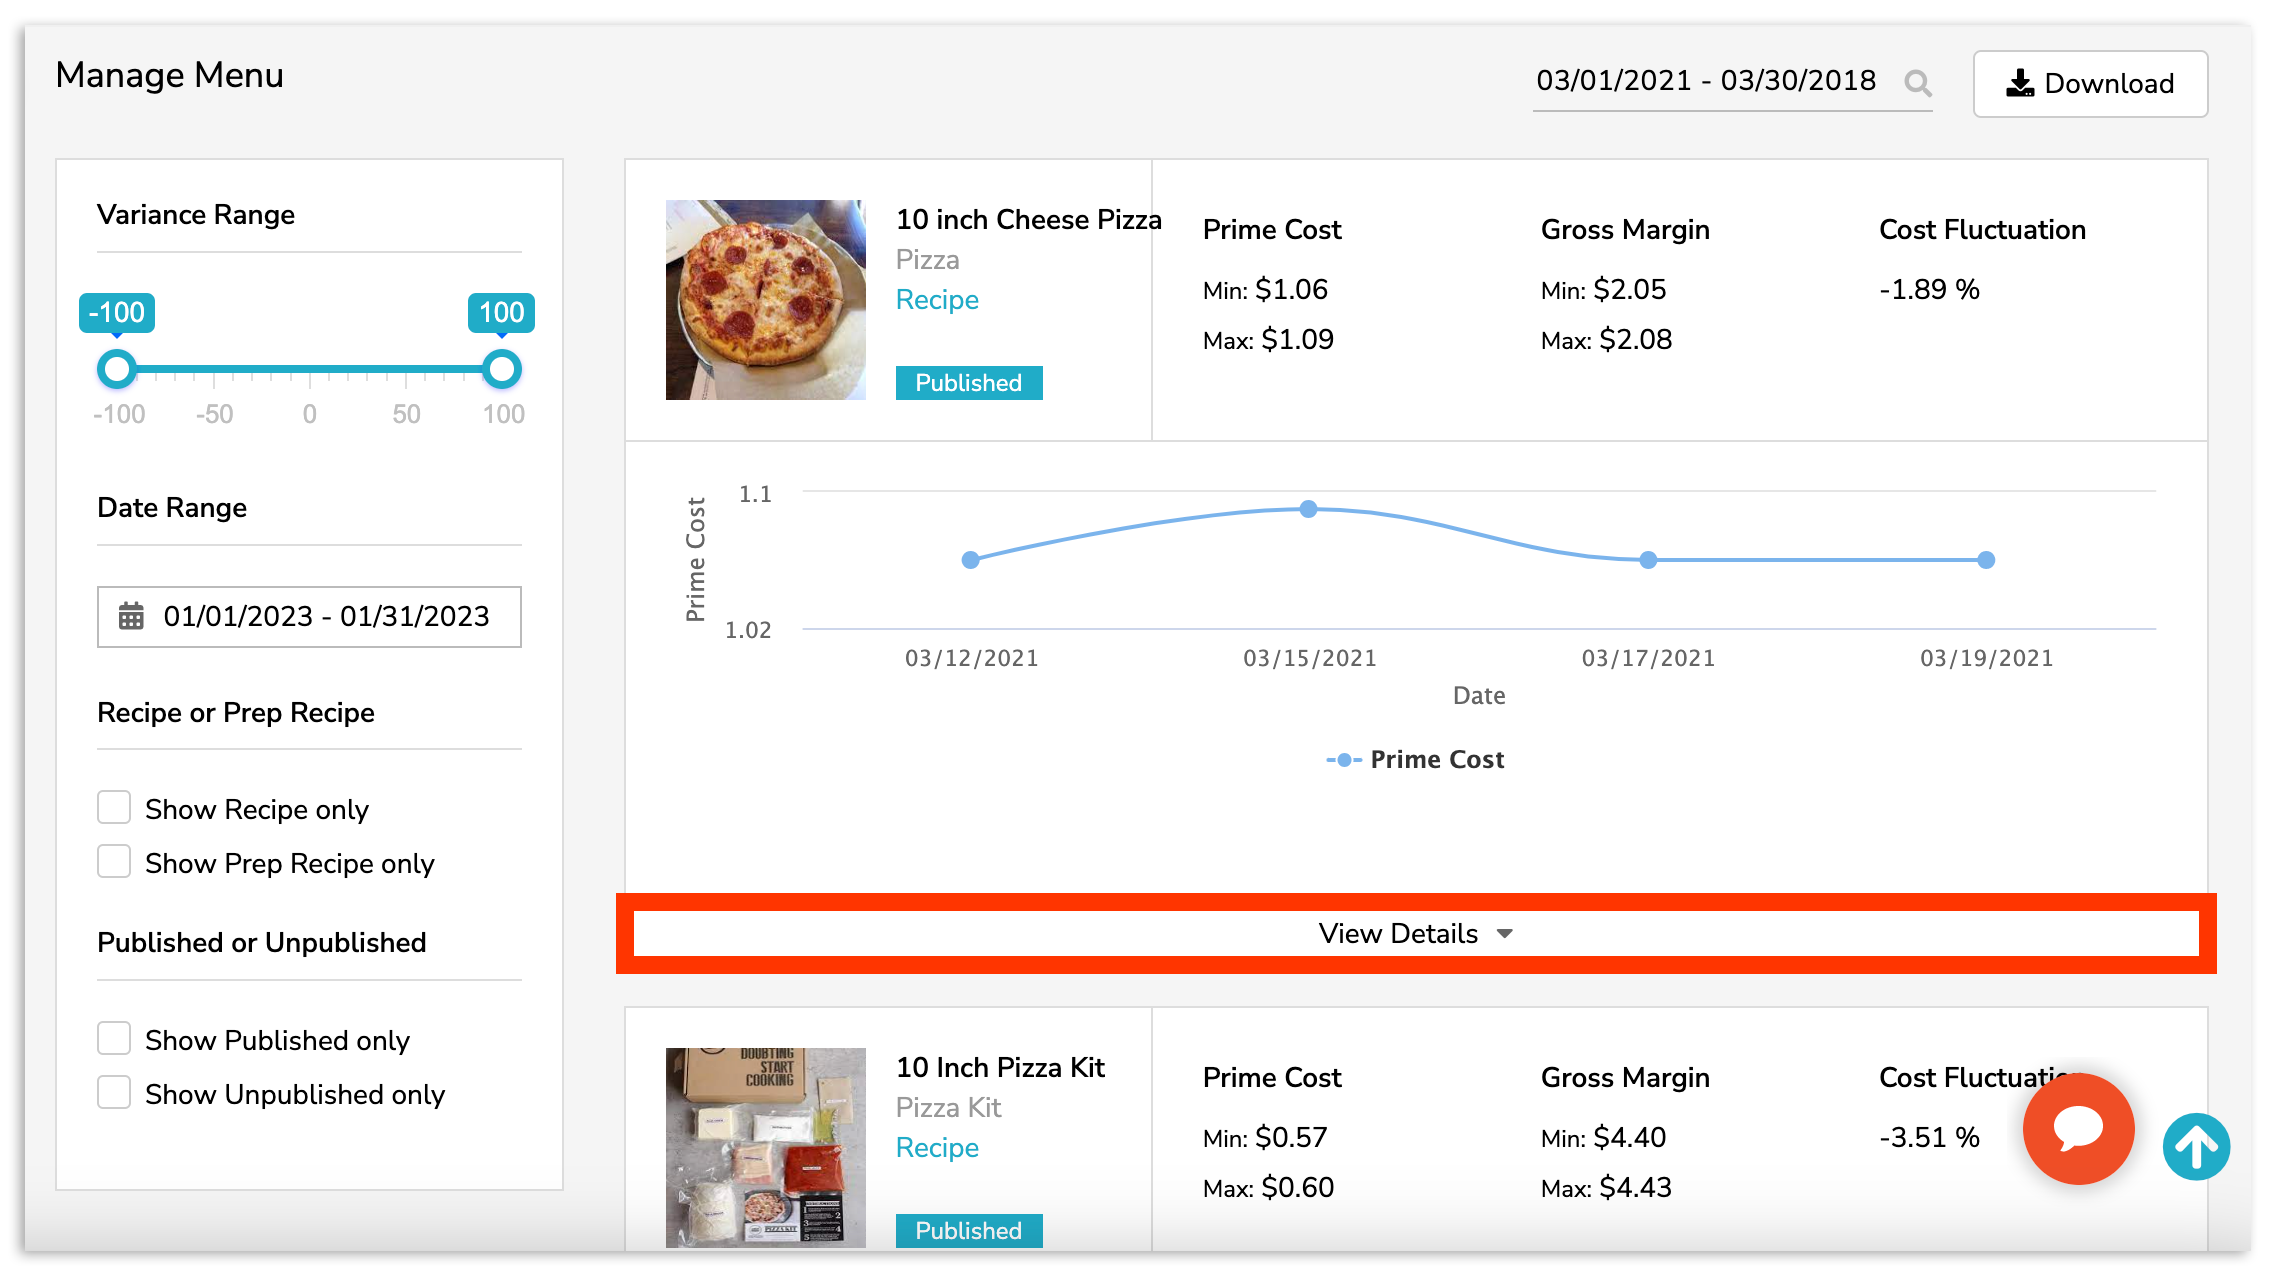
You can dive into an individual recipe for in-depth insights into your plate costs, and profit margins, as well as a line graph showing how the price of ingredients in the recipe changed over time. To do this, select View Details.
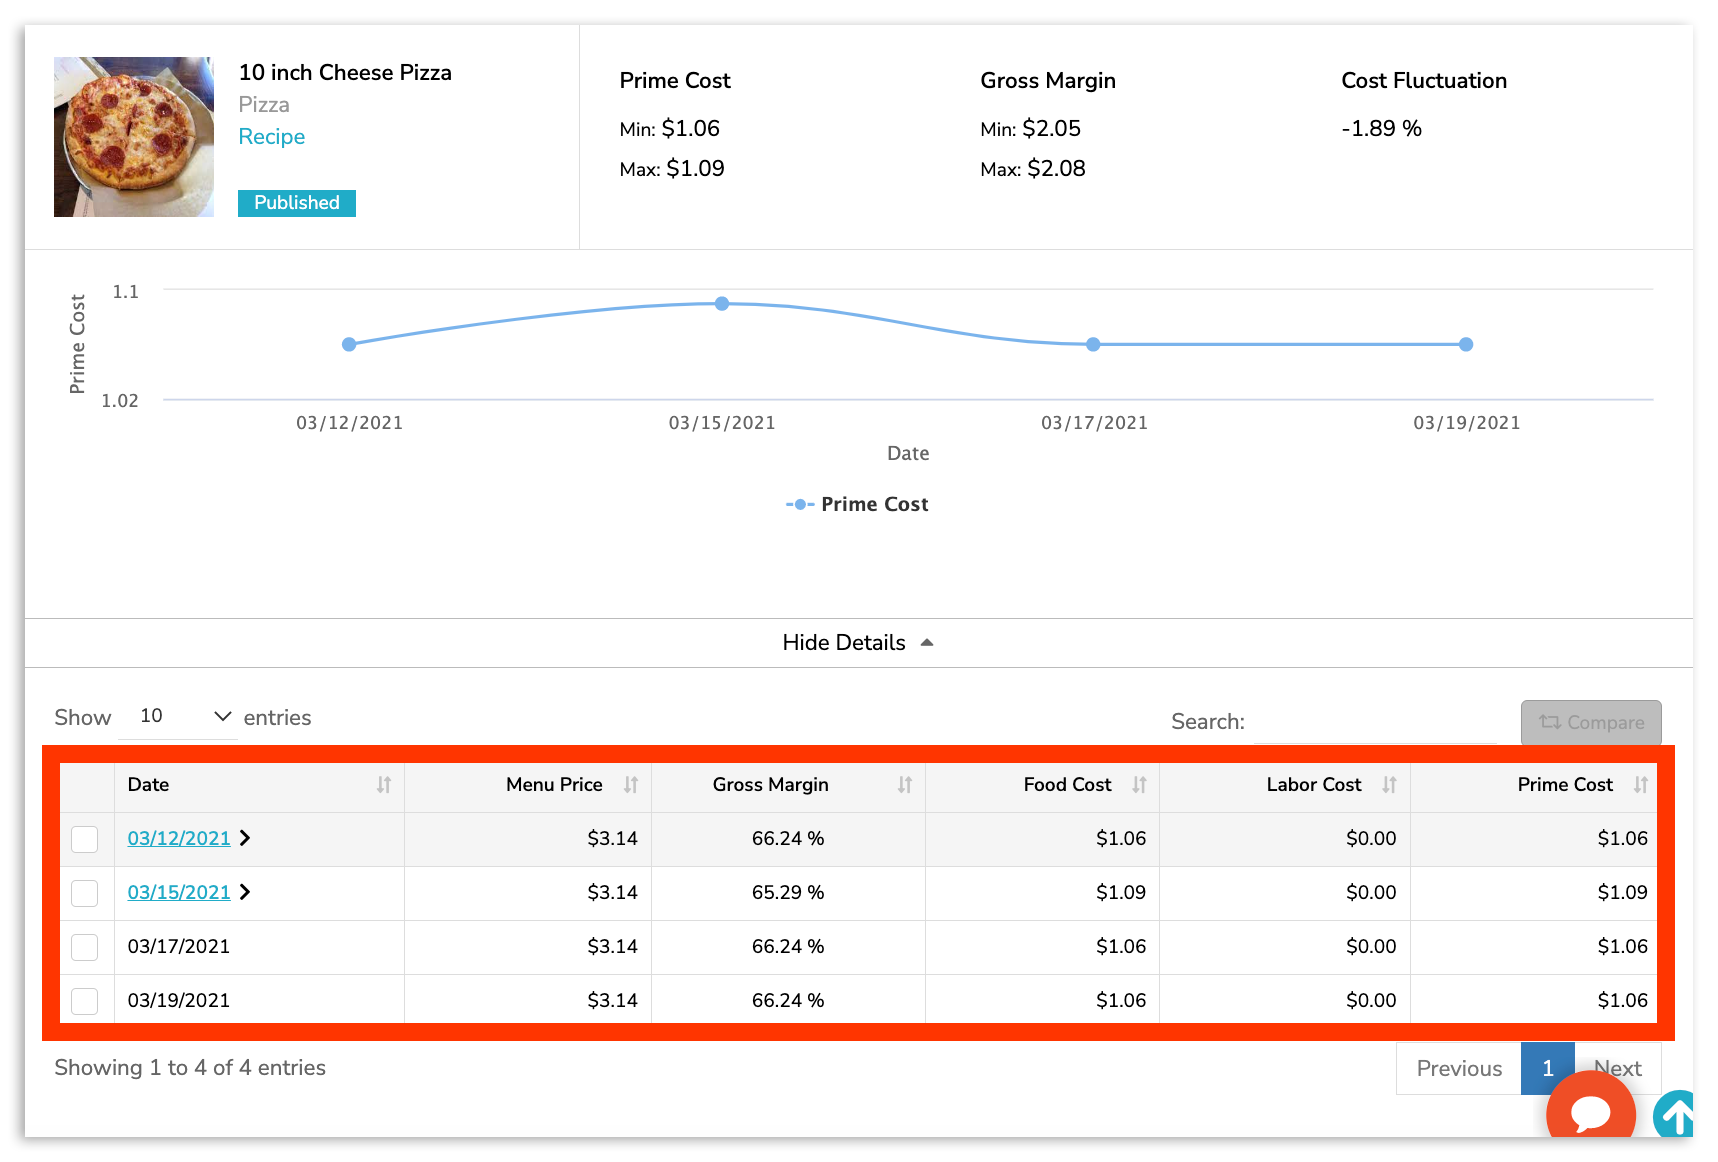
Then review the data of each individual date. For days with a fluctuation in cost, you can even review the specific ingredients that contributed to a rising or falling prime cost by selecting the date (highlighted in blue).
Product Mix Report
Once Product Mix Mapping has been completed, your Product Mix Report will begin to populate with actionable data. Your Product Mix report gives you deeper insights than just tracking daily sales alone. Go beyond simple numbers and see which items are discounted the most, which net you the highest profits, and which cost more than they make.
Product Mix Report Guide
To view this report, select Product Mix Report from the Recipe page. You'll have tabs to view your sales By Menu Item or By Modifier. You can also customize the data according to specific date ranges using the date range and calendar icon just below the tabs.
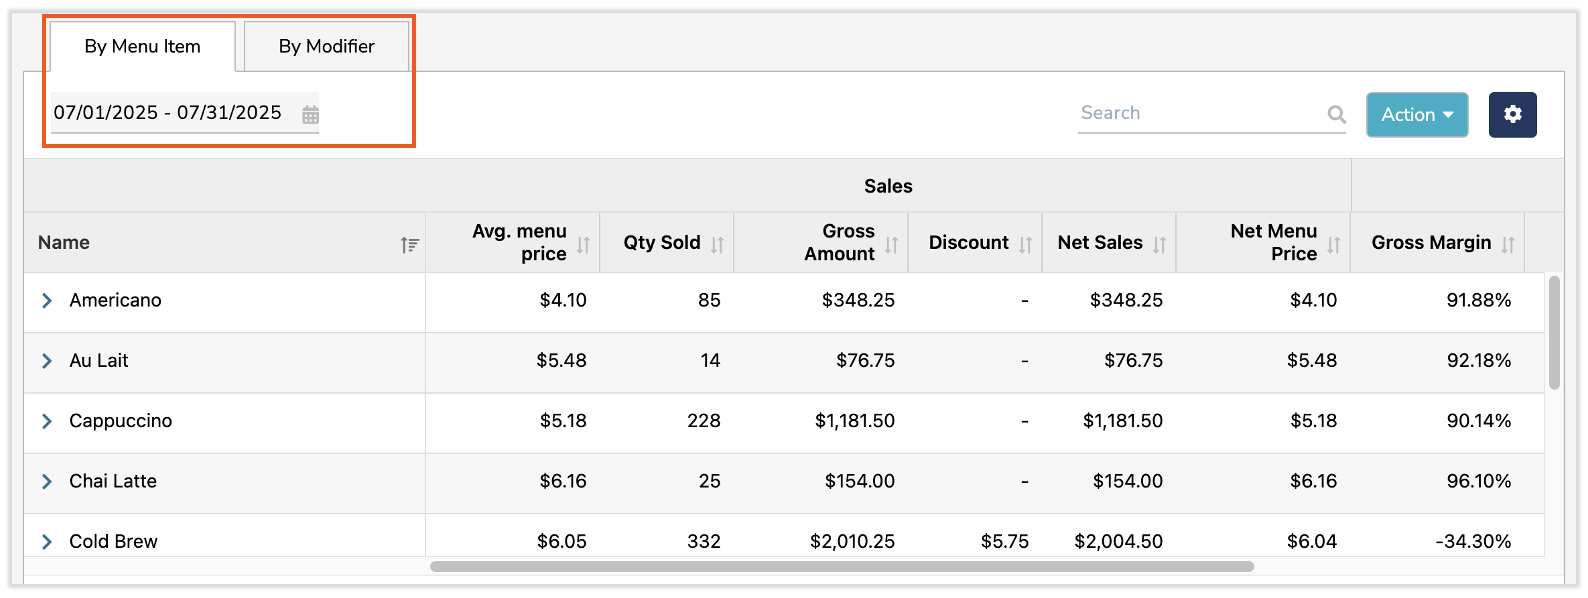
These tabs are essentially filters by which you can view your sales reporting:
- By Menu Item will drill into your sales and margins for specific Menu Items. Selecting the > carat icon to the left of an item in your data set will reveal insight by date. This report is often utilized to explore margins by menu item, identify top-performing items, and reveal how discounts affect profit.
- By Modifier will drill into your sales and margins solely for your existing Toast modifiers. Selecting the > carat icon to the left of a modifier in your data set will reveal insight by the corresponding (and modified) menu item. This report is often utilized to explore how modifiers affect margins.
Modifiers can affect Prime Cost in the PMIX report—but only if they are mapped in xtraCHEF.
Here's how it works:
Base Recipe: Every menu item is mapped to a recipe. The recipe's plate cost forms the base Prime Cost.(Food cost in recipes)
Add-on Modifiers: If a modifier (e.g., "Add Bacon", "Extra Cheese", "Add Avocado") is mapped to a Product or Prep Recipe with a defined quantity, xtraCHEF adds the cost of that modifier to the Prime Cost for orders where it was selected.
Removal Modifiers: If a modifier removes an ingredient (e.g., "No Cheese"), you can enable the Subtract option in Modifier Mapping. xtraCHEF will subtract the mapped ingredient cost from the recipe cost for those orders.
Nested and Size Modifiers: These can also be mapped and included in PMIX costing when configured appropriately.
Example:
Suppose your Burger recipe costs $6.00.
Customer orders Burger → Prime Cost = $6.00
Customer orders Burger + Add Bacon (bacon costs $1.25) → Prime Cost = $7.25
Customer orders Burger - No Cheese (cheese costs $0.50 and the modifier is configured to subtract) → Prime Cost = $5.50
Product Mix Report Columns
Your data will be broken out and presented in Sales and Cost related columns. Your Sales columns will lay out information such as your average menu price, the quantity of each menu item sold, total discounts, and gross and net sales values. Definitions of these columns can be found in the table below.
| Column Name | Definition |
| Menu Price | This is the price your menu item sells for, synced directly from your Toast POS. |
| Qty Sold | This is the quantity sold of the corresponding menu item. |
| Gross Amount | Your Gross Amount is the sales total for a corresponding menu item. It's important to note that this total does not consider variables such as discounts. (Formula: Menu Price x Quantity Sold) |
| Discounts | Discounts will display the total discount amount given to customers between your set date range. |
| Net Sales | Net Sales is the sales total for a corresponding menu item. Compared to Gross Sales, Net Sales have been adjusted to factor in your discount amount for a more accurate breakdown of your sales total by menu item. (Formula: (Menu Price x Quantity Sold) - Discounts) |
| Net Menu Price | Net Menu Price factors in your discounts to create an average menu price per order. (Formula: Net Sales / Qty Sold) |
On the other hand, the Cost columns compare your sales information with prime costs from corresponding recipes. The result is gross and net margin reporting for your consideration. Definitions of these columns can be found in the table below.
| Column Name | Definition |
| Gross Margin | Gross Margin is your expected profit, not including variables such as discounts. |
| Net Margin | Net Margin is your expected profit, including variables such as discounts. |
| Prime Cost | Prime Cost is your cost of sale for a corresponding menu item. |
Are your margins too low? Perhaps raising your menu item price, scaling back portions, or turning to different vendors for better pricing could offset unhealthy margins spotlighted by your Product Mix report.
Next Steps
Do you want to see how variables such as waste, shrinkage, theft, and more might affect these margins? Start taking physical inventory counts in xtraCHEF.
Doing so will enable you to view your Inventory Analytics and track your theoretical and actual inventory consumption, monitor inventory depletion, identify waste, and control your restaurant costs for maximum profitability.
Learn how to get started with xtraCHEF: Get Started With Inventory Area Setup and Count Lists.