xtraCHEF:差异分析与产品组合报告
上次更新时间:2026年7月9日 10:56
配方报告摘要
一旦您创建了 配方和预制配方 并完成了 产品组合映射,xtraCHEF 将能够自动创建高级配方相关报告。
更具体地说,通过结合您来自 Toast 的每日销售额以及 xtraCHEF 跟踪实时菜品成本和差异更新的能力,您可以跟踪菜单的健康状况,并重点指出可以在哪些方面进行改进以提高盈利能力。
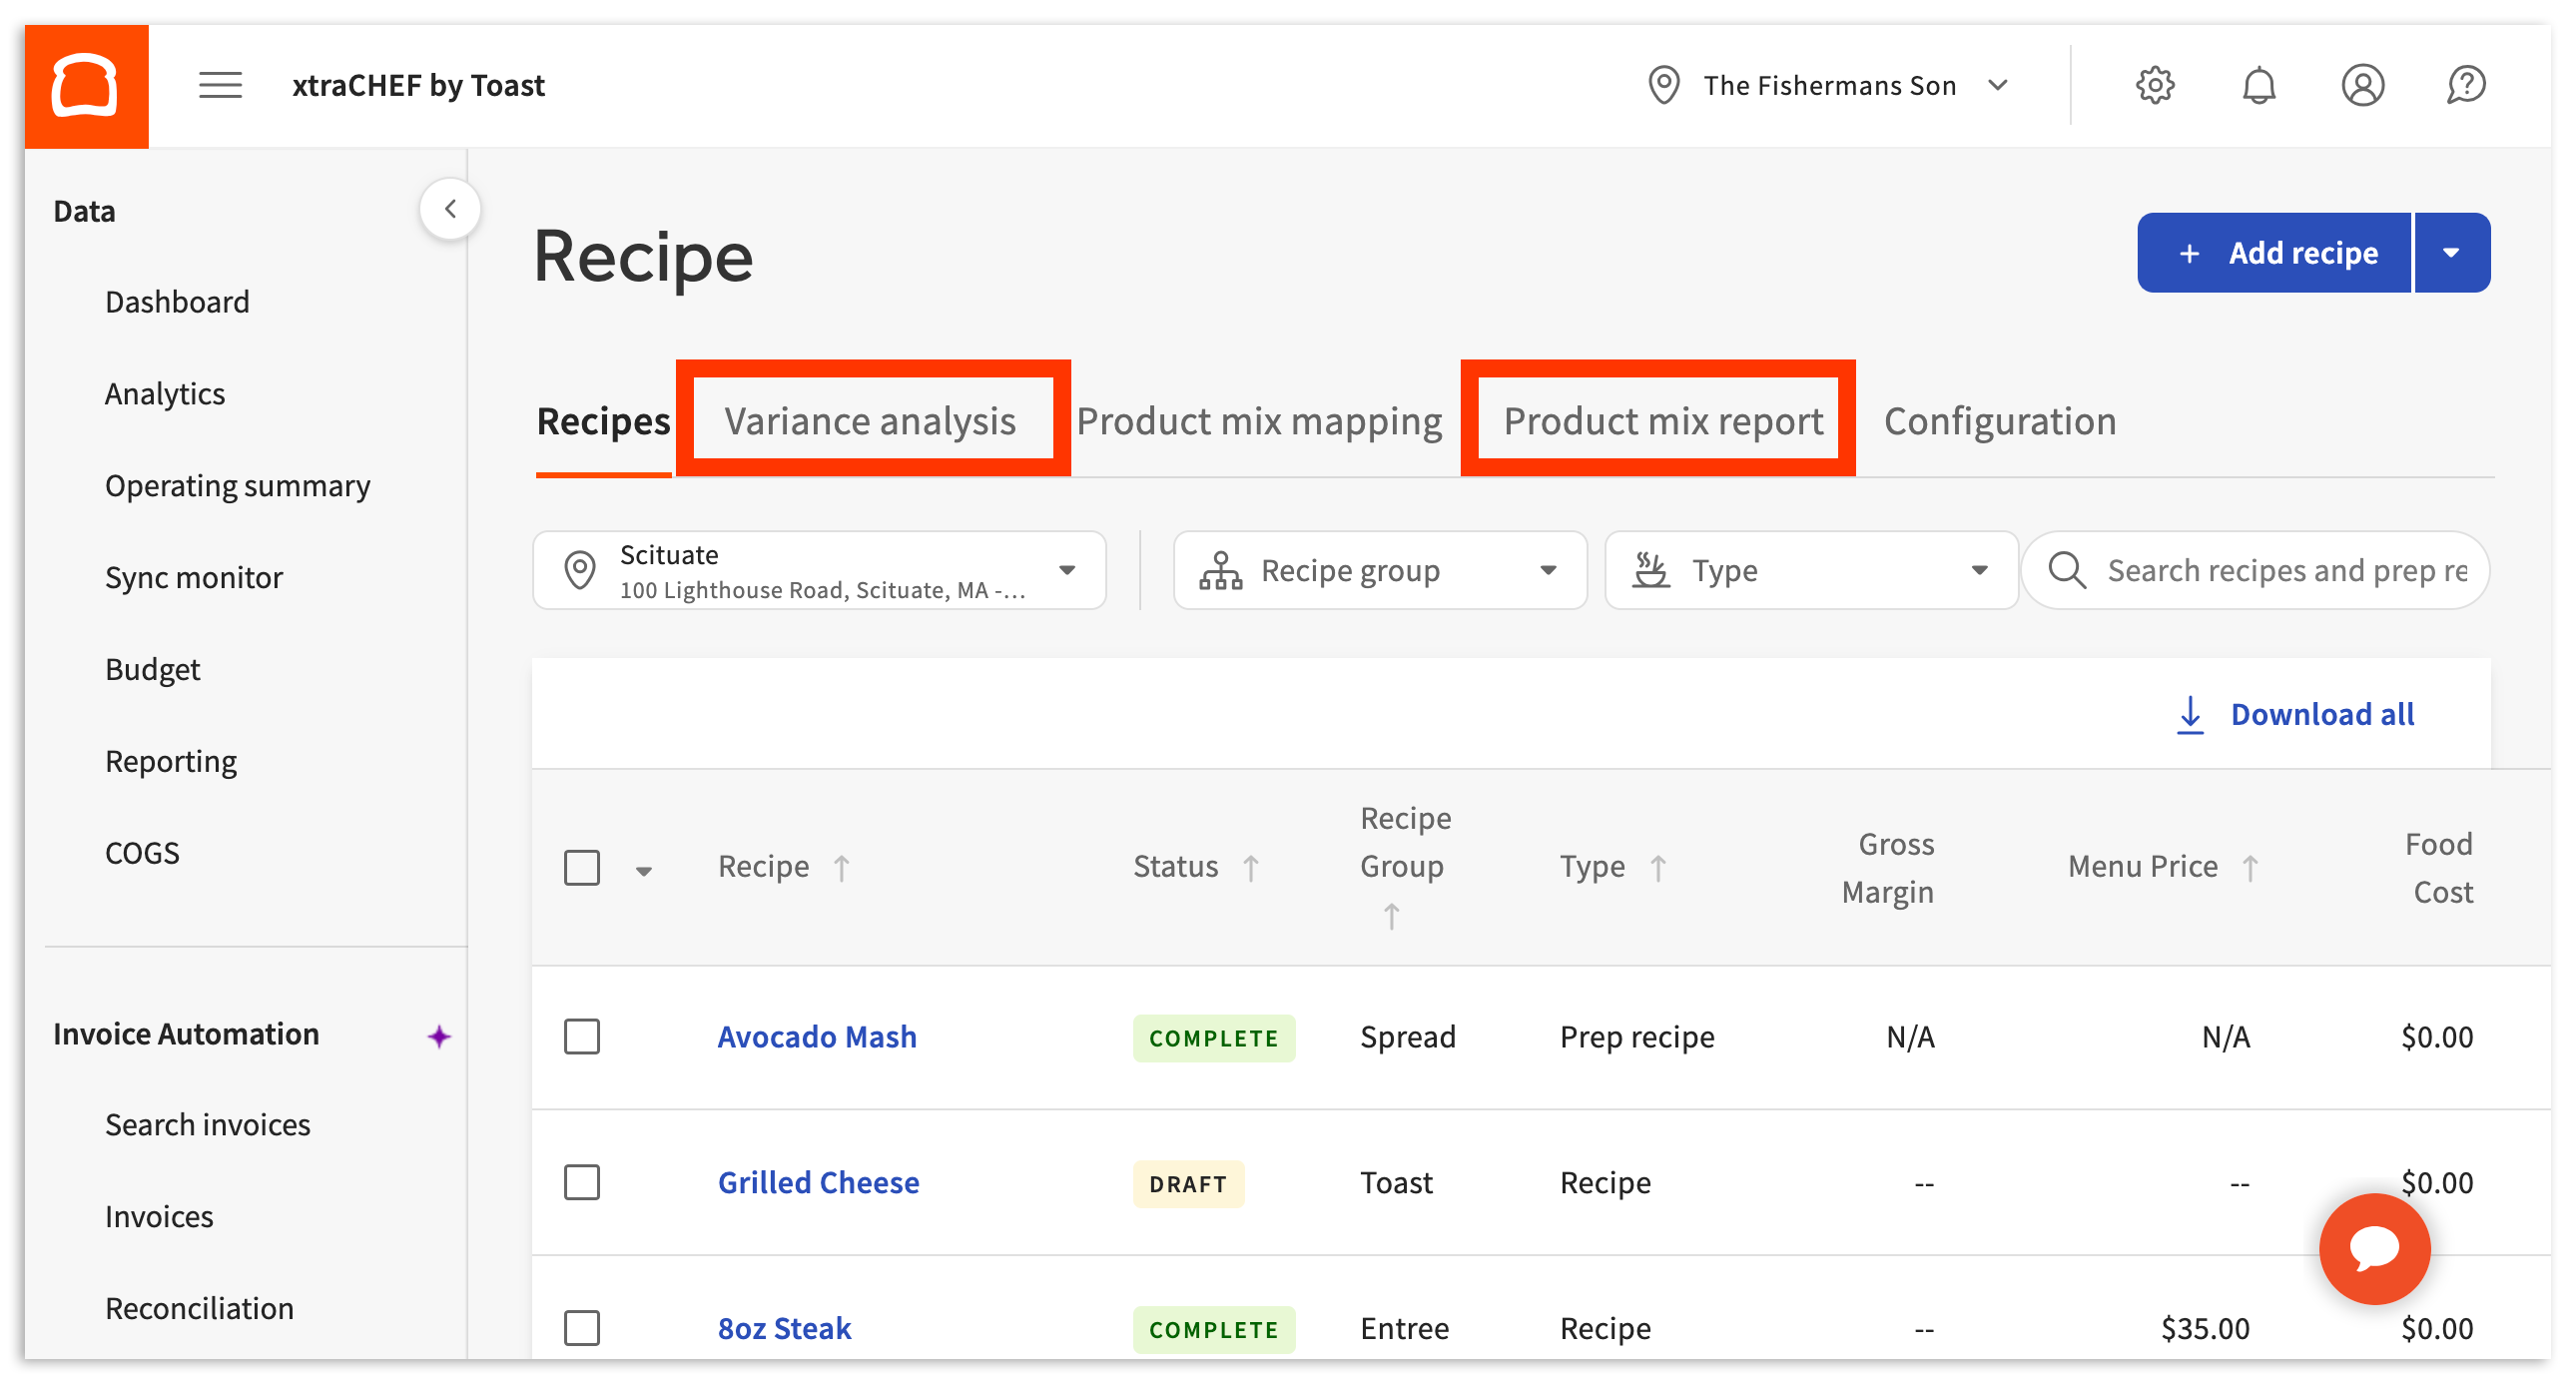
您可以通过选择 xtraCHEF 账户导航栏上的 配方 选项卡找到 差异分析 和 产品组合报告。 然后选择 差异分析 或 产品组合报告(必须完成产品组合映射此报告才能填充;请尽快映射您的产品,因为无法进行追溯性产品组合报告)。
差异分析
差异分析 选项卡跟踪您的配方成分成本随时间的变化情况。这使您能够更全面地了解您的定价策略,并在未来需要提价时提供数据驱动的依据。
当您扫描发票时,xtraCHEF 会自动跟踪您在准备配方和配方中使用的产品成本。因此,您可以跟踪那些原本可能没有时间手动分析的增量价格变化。
差异分析指南
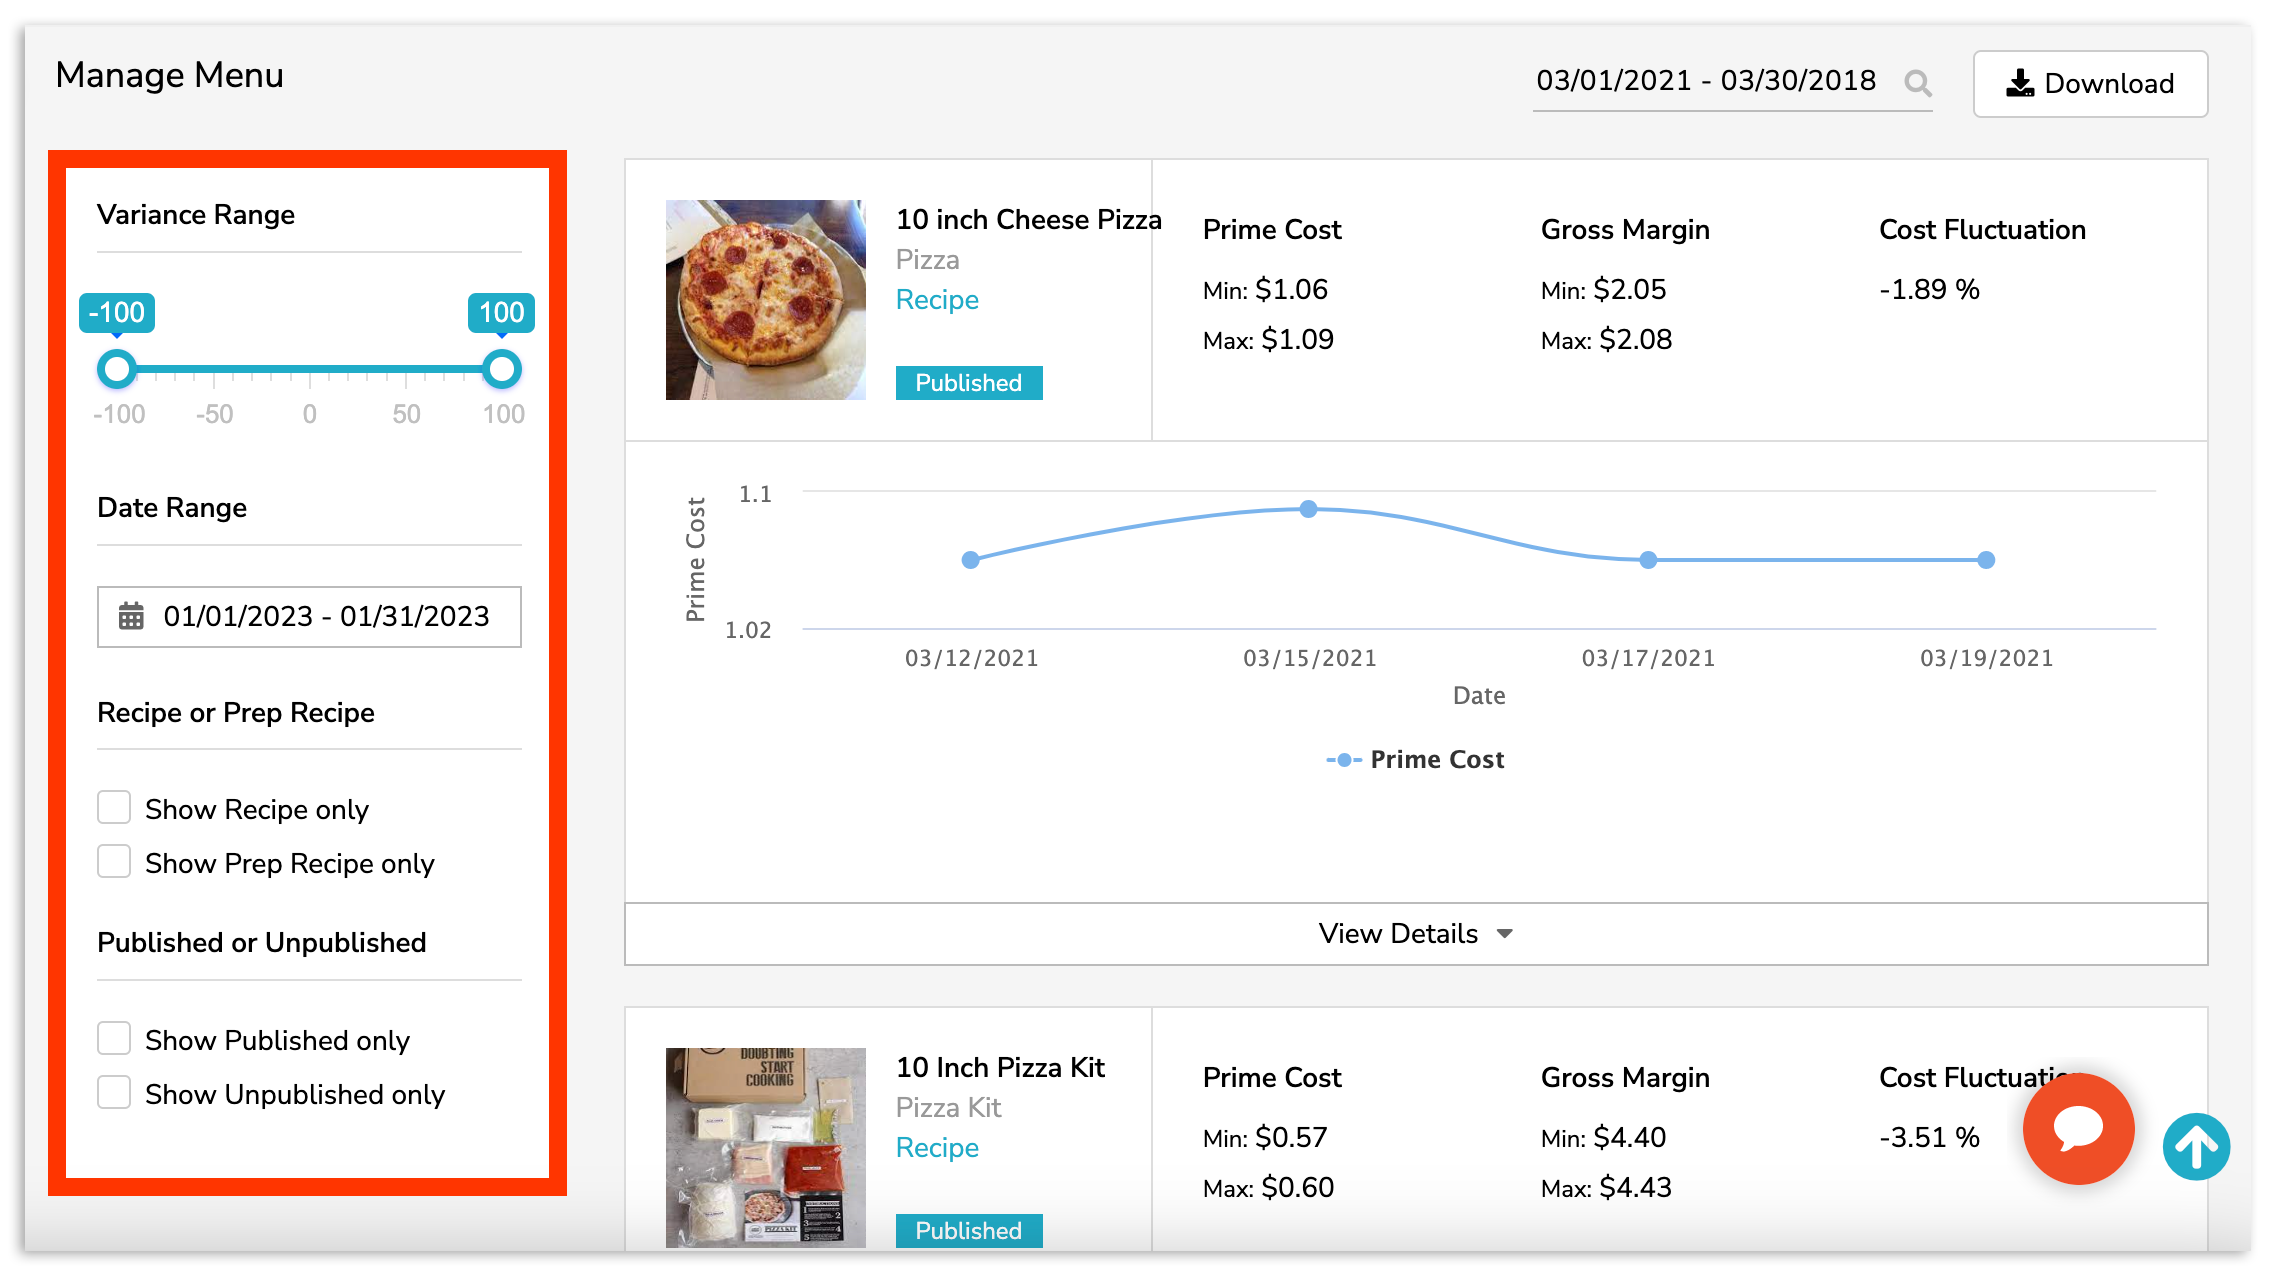
默认情况下,您的每个配方和准备配方都会被列出,但您可以使用页面左侧的选项来自定义显示结果。
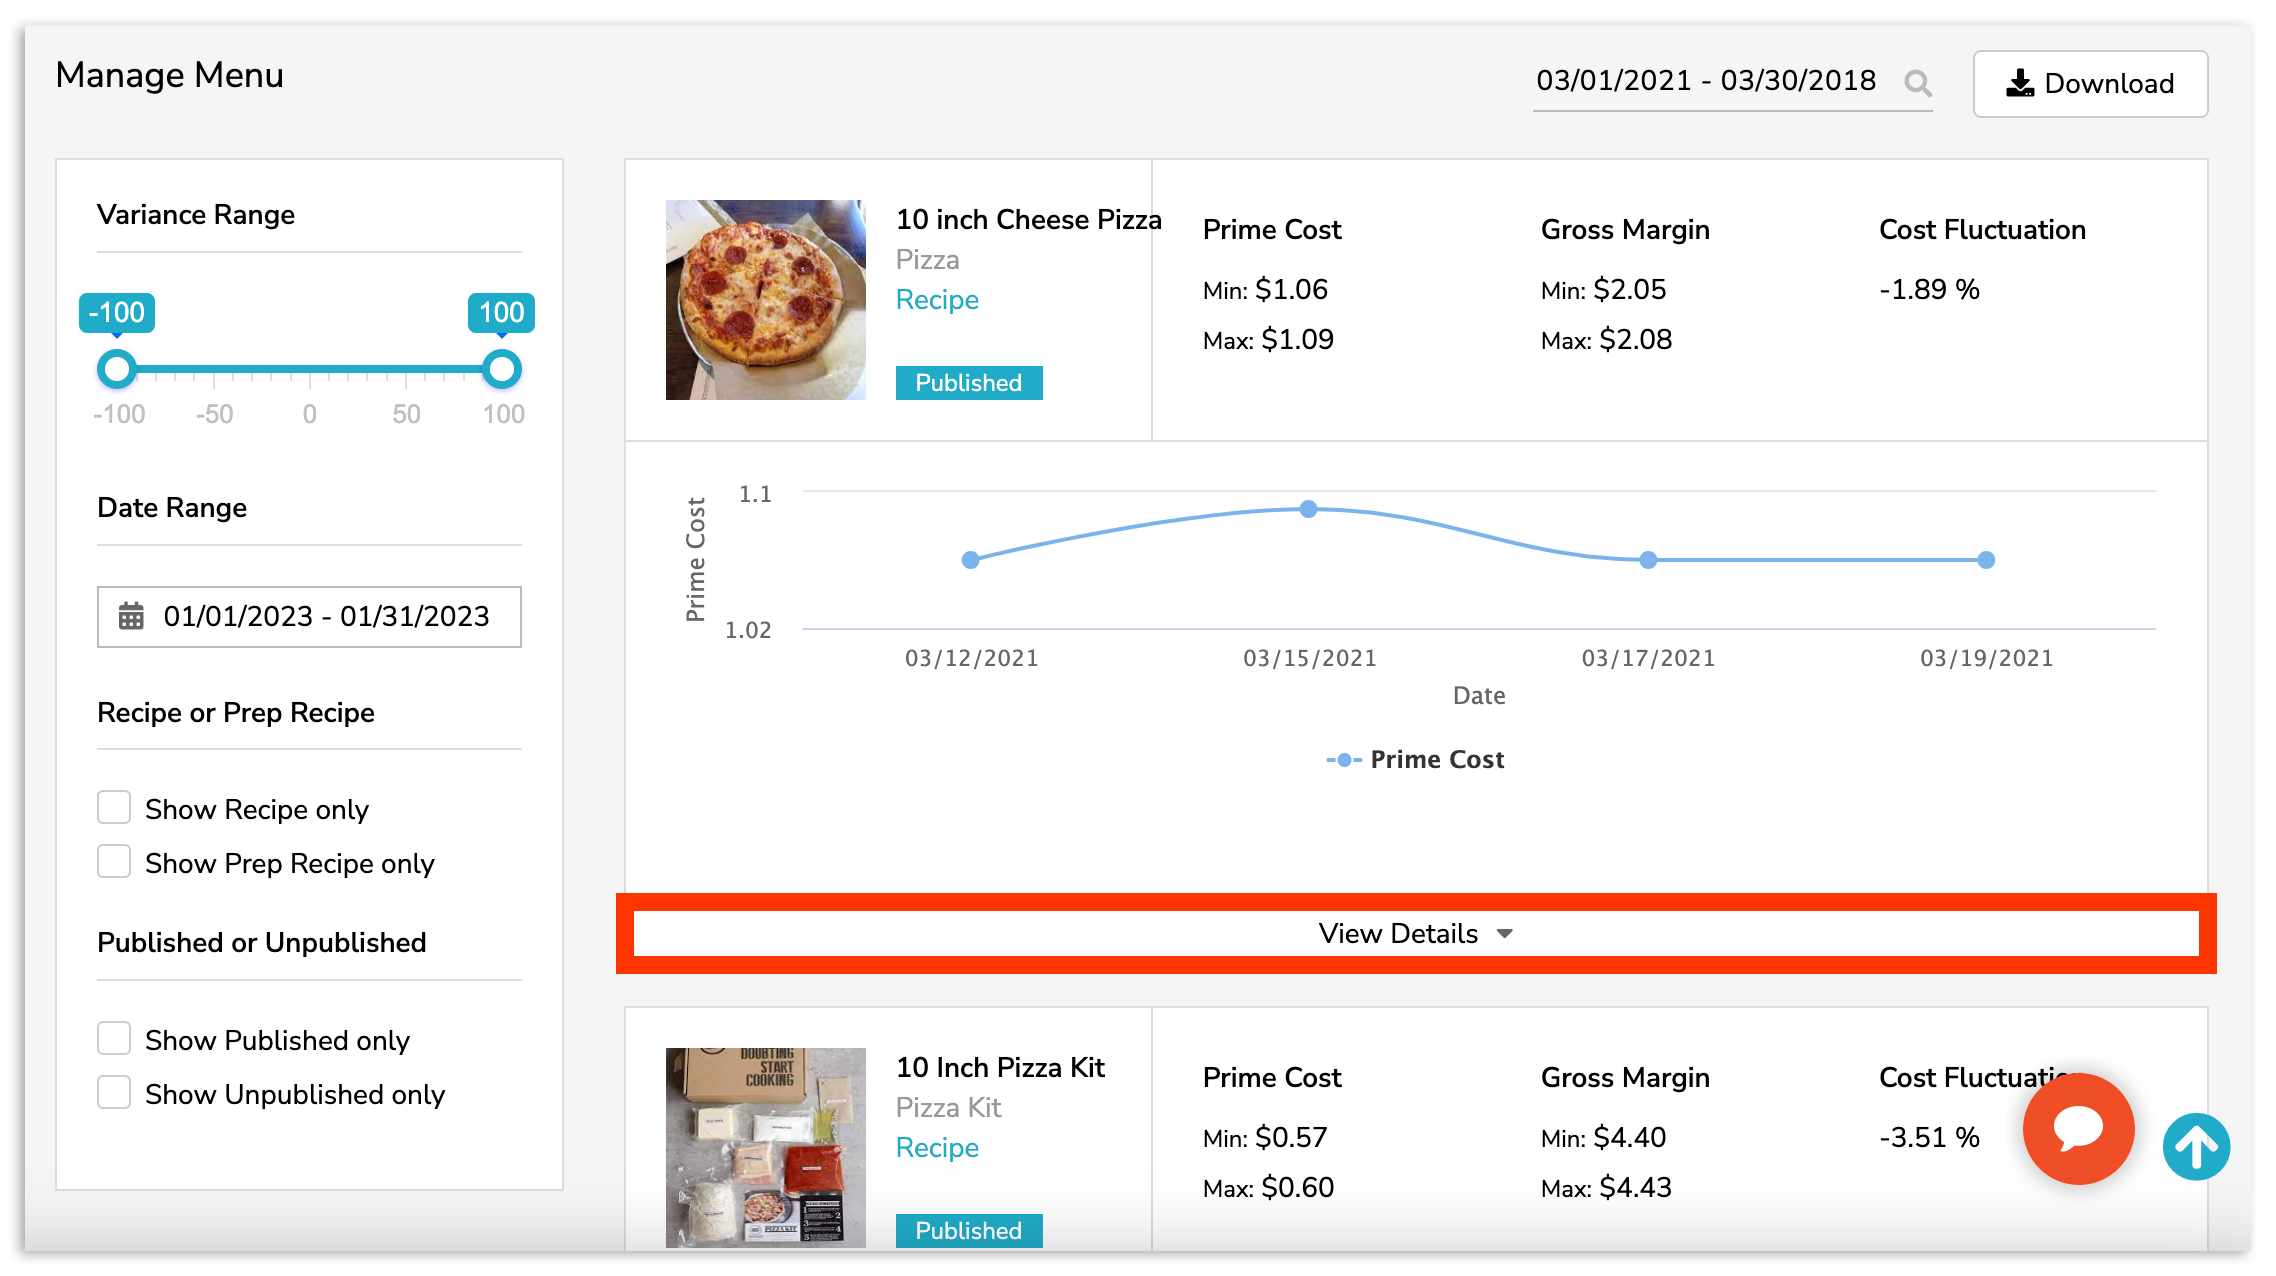
您可以深入研究单个配方,以获得关于您的盘子成本和利润率的深入见解,以及显示配方中配料价格随时间变化的折线图。要执行此操作,请选择 查看详情。
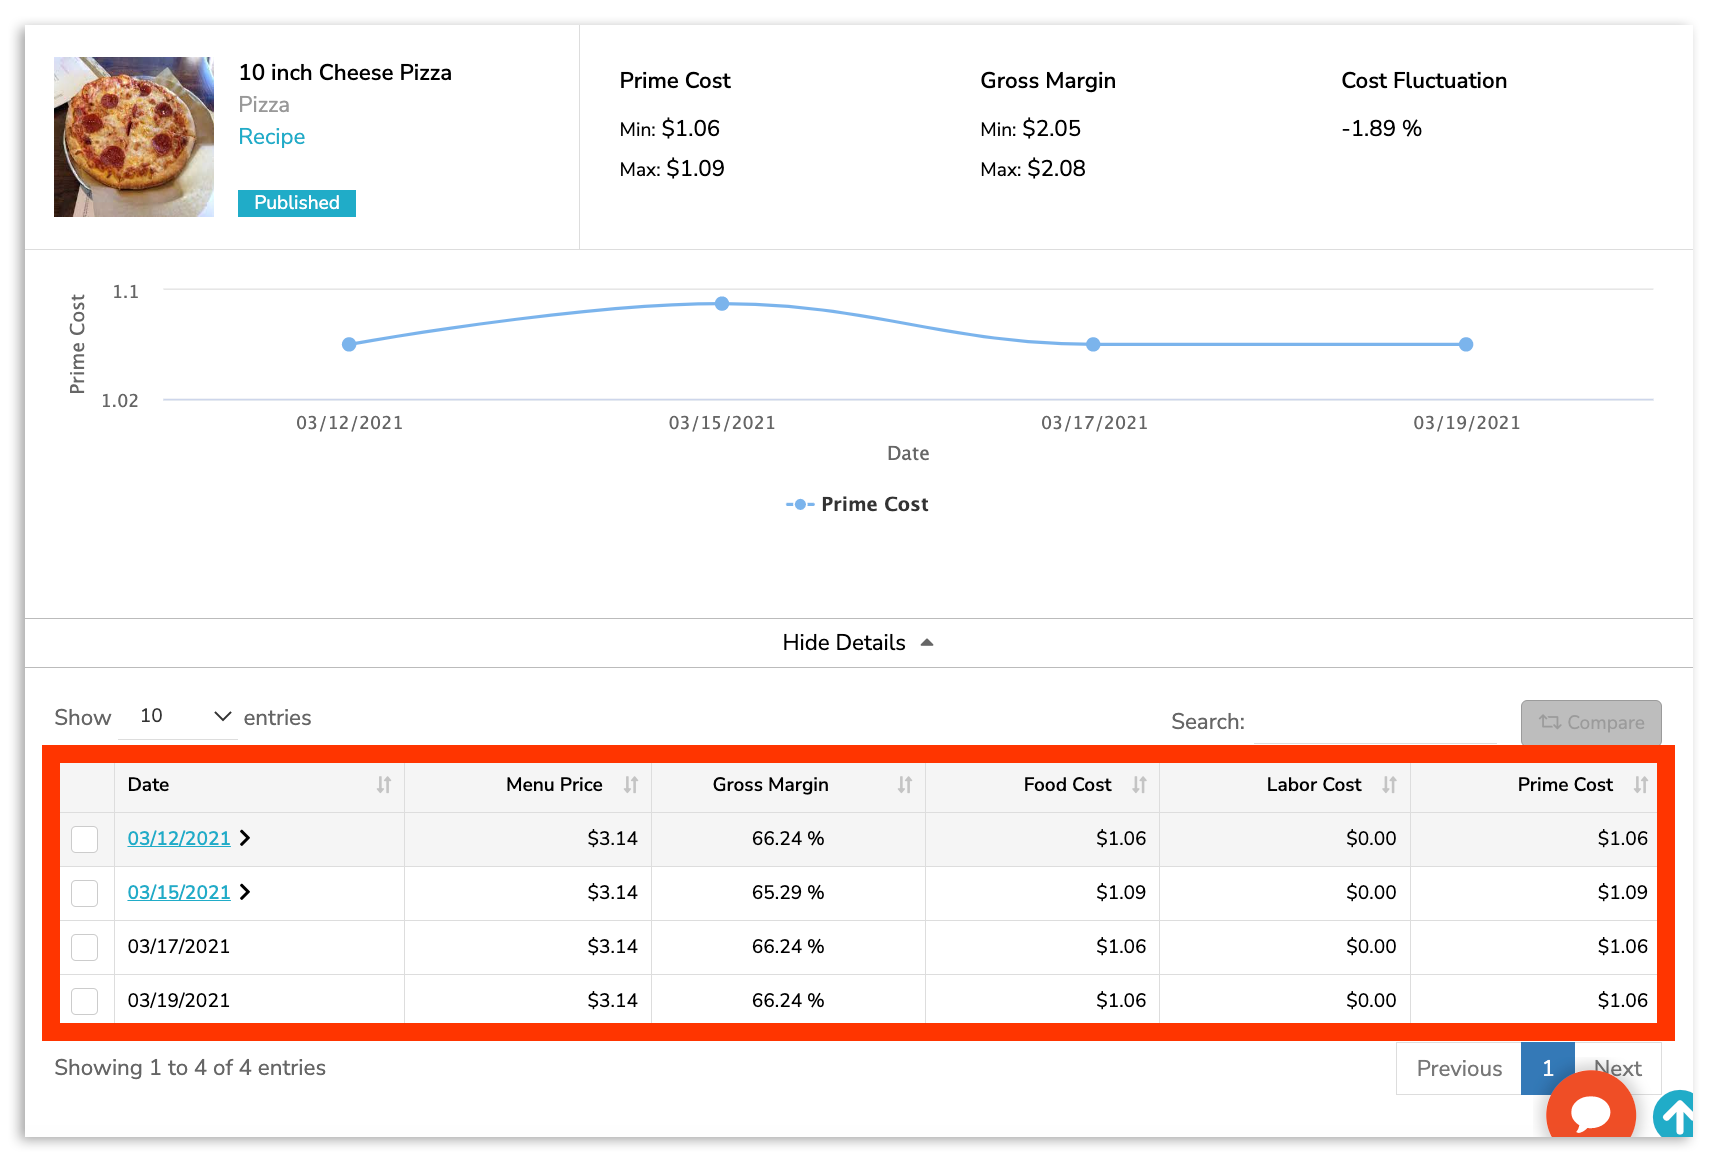
然后查看每个单独日期的数据。对于成本波动的日期,您甚至可以通过选择日期(以蓝色突出显示)来查看导致主要成本上升或下降的具体配料。
产品组合报告
一旦完成产品组合映射,您的 产品组合报告 将开始填充可操作的数据。您的产品组合报告为您提供的见解比单纯跟踪每日销售额更深入。超越简单的数字,看看哪些商品折扣最多,哪些为您带来最高利润,以及哪些商品的成本高于其收益。
产品组合报告指南
要查看此报告,请从“配方”页面选择 产品组合报告。您将拥有多个选项卡来查看 按菜单项 或 按修饰符 的销售额。您还可以使用选项卡下方的日期范围和日历图标,根据特定日期范围自定义数据。
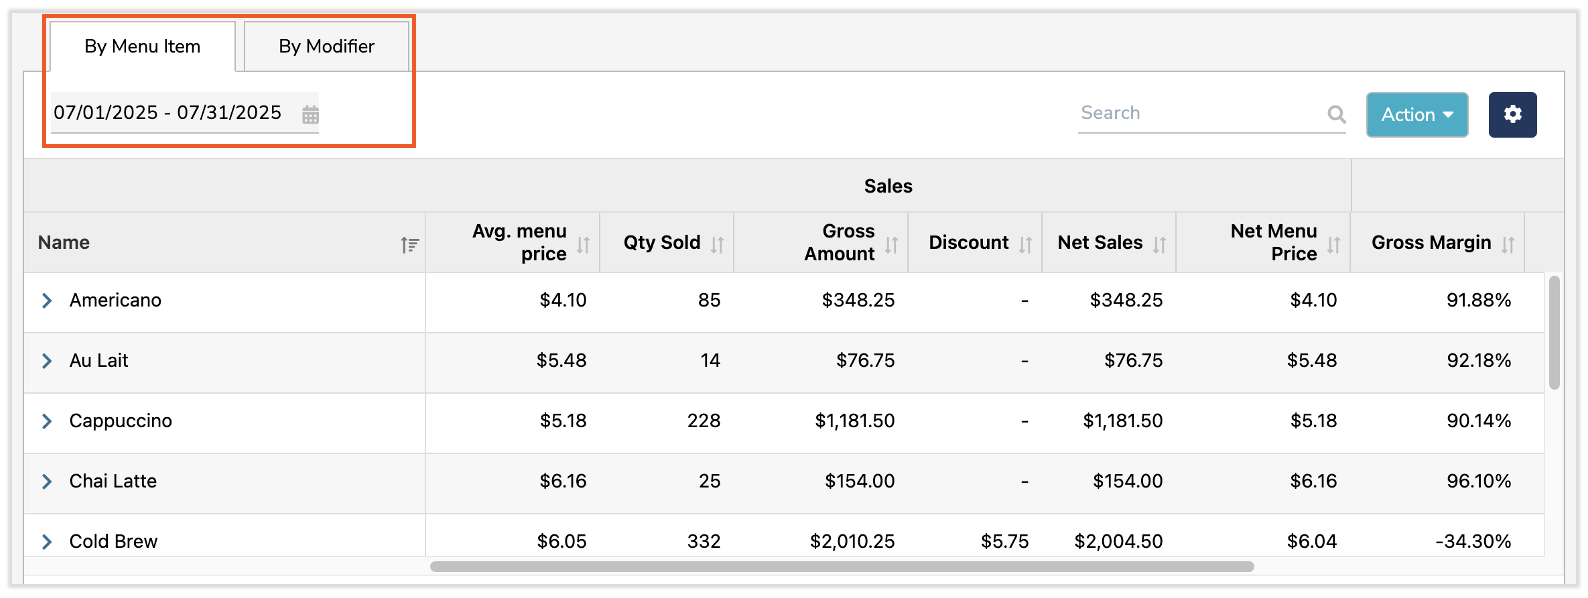
这些选项卡本质上是过滤器,您可以通过它们查看销售报告:
- 按菜单项将深入分析特定菜单项的销售额和利润率。选择数据集中项目左侧的>插入符号图标将显示按日期划分的见解。此报告通常用于按菜单项探索利润率、识别表现最好的项目,并揭示折扣如何影响利润。
- 按修饰符将仅深入分析您现有Toast修饰符的销售额和利润率。选择数据集中修饰符左侧的>插入符号图标将显示按相应(和已修改)菜单项划分的见解。此报告通常用于探索修饰符如何影响利润率。
修饰符可以影响PMIX报告中的主要成本,但前提是它们已在xtraCHEF中映射。
其工作原理如下:
基础配方:每个菜单项都映射到一个配方。配方的盘子成本构成了基础主要成本。(配方中的食品成本)
附加修饰符:如果修饰符(例如“加培根”、“加芝士”、“加牛油果”)映射到具有定义数量的产品或准备配方,xtraCHEF会将该修饰符的成本添加到已选择该修饰符的订单的主要成本中。
移除修饰符:如果修饰符移除了某种配料(例如“不要芝士”),您可以在“修饰符映射”中启用“减去”选项。xtraCHEF将从这些订单的配方成本中减去映射的配料成本。
嵌套和尺寸修饰符:在适当配置的情况下,这些也可以映射并包含在PMIX成本计算中。
示例:
假设您的汉堡配方成本为 $6.00。
顾客点汉堡 → 主要成本 = $6.00
顾客点汉堡 + 加培根(培根成本 $1.25) → 主要成本 = $7.25
顾客点汉堡 - 去芝士(芝士成本 $0.50,且修饰符配置为减去) → 主要成本 = $5.50
产品组合报告列
您的数据将被拆分并显示在 销售 和 成本 相关列中。您的 销售 列将列出诸如平均菜单价格、各菜单项销售数量、折扣总额以及毛销售额和净销售额等信息。这些列的定义可在下表中找到。
| 列名称 | 定义 |
| 菜单价格 | 这是您的菜单项售价,直接从您的 Toast POS 同步而来。 |
| 销售数量 | 这是相应菜单项的销售数量。 |
| 总金额 | 您的总金额是相应菜单项的销售总额。需要注意的是,该总额未考虑折扣等变量。(公式:菜单价格 x 销售数量) |
| 折扣 | 折扣将显示您在设定的日期范围内给予客户的折扣总额。 |
| 净销售额 | 净销售额是相应菜单项的销售总额。与总销售额相比,净销售额已进行调整,将您的折扣金额考虑在内,以便更准确地按菜单项细分您的销售总额。(公式:(菜单价格 x 销售数量)- 折扣) |
| 净菜单价格 | 净菜单价格将您的折扣考虑在内,以得出每份订单的平均菜单价格。(公式:净销售额 / 销售数量) |
另一方面,成本列将您的销售信息与相应配方的主要成本进行了比较。结果是供您参考的毛利和净利报告。这些列的定义可在下表中找到。
| 列名 | 定义 |
| 毛利率 | 毛利率是您的预期利润,不包括折扣等变量。 |
| 净利率 | 净利率是您的预期利润,包括折扣等变量。 |
| 主要成本 | 主要成本是您相应菜单项的销售成本。 |
您的利润率是否太低?或许提高菜单项价格、缩减份量或转向不同的供应商以获得更好的价格,可以抵消产品组合报告中突显的不健康利润率。
下一步
您是否想了解诸如浪费、损耗、盗窃等变量如何影响这些利润率?开始在 xtraCHEF 中进行实物库存盘点。
这样做将使您能够查看库存分析并跟踪您的理论和实际库存消耗,监控库存消耗,识别浪费,并控制您的餐厅成本以实现最大化盈利。
了解如何开始使用 xtraCHEF:开始设置库存区域和盘点清单。