xtraCHEF: Review Analytics Reports
Last updated: Jul 7, 2026, 3:35 PM
Analytics Overview
In xtraCHEF, your Analytics tab automatically breaks out purchase and sales-related data into quick glance reports. By frequently checking in on your Analytics, you’re able to increase visibility into the overall health of your restaurant and keep tabs on spending before trends become a hazard to your overall profitability.
There are a number of different options available in your xtraCHEF account. Each of these provides a high-level overview of spending, costs, or both broken out alongside easily digestible visuals.
Back to top
Your Analytics
To access these tools, select Analytics from your navigation bar. Here, you’re able to continue navigating to a number of different reports, namely Spending by General Ledger (GL), Category Weekly, Food Cost Weekly, Spending by Category, Spending by Vendor, Volume, and Unit Comparison.
A description of these analytics and their use cases are broken out below.
Spending by GL
Want to see what’s eating up the biggest chunk of your budget between a set date range? Spending by GL breaks out all of your spending by general ledger code, allowing you to quickly identify unexpected trends or just keep an eye on how funds are generally being allocated for purchasing.
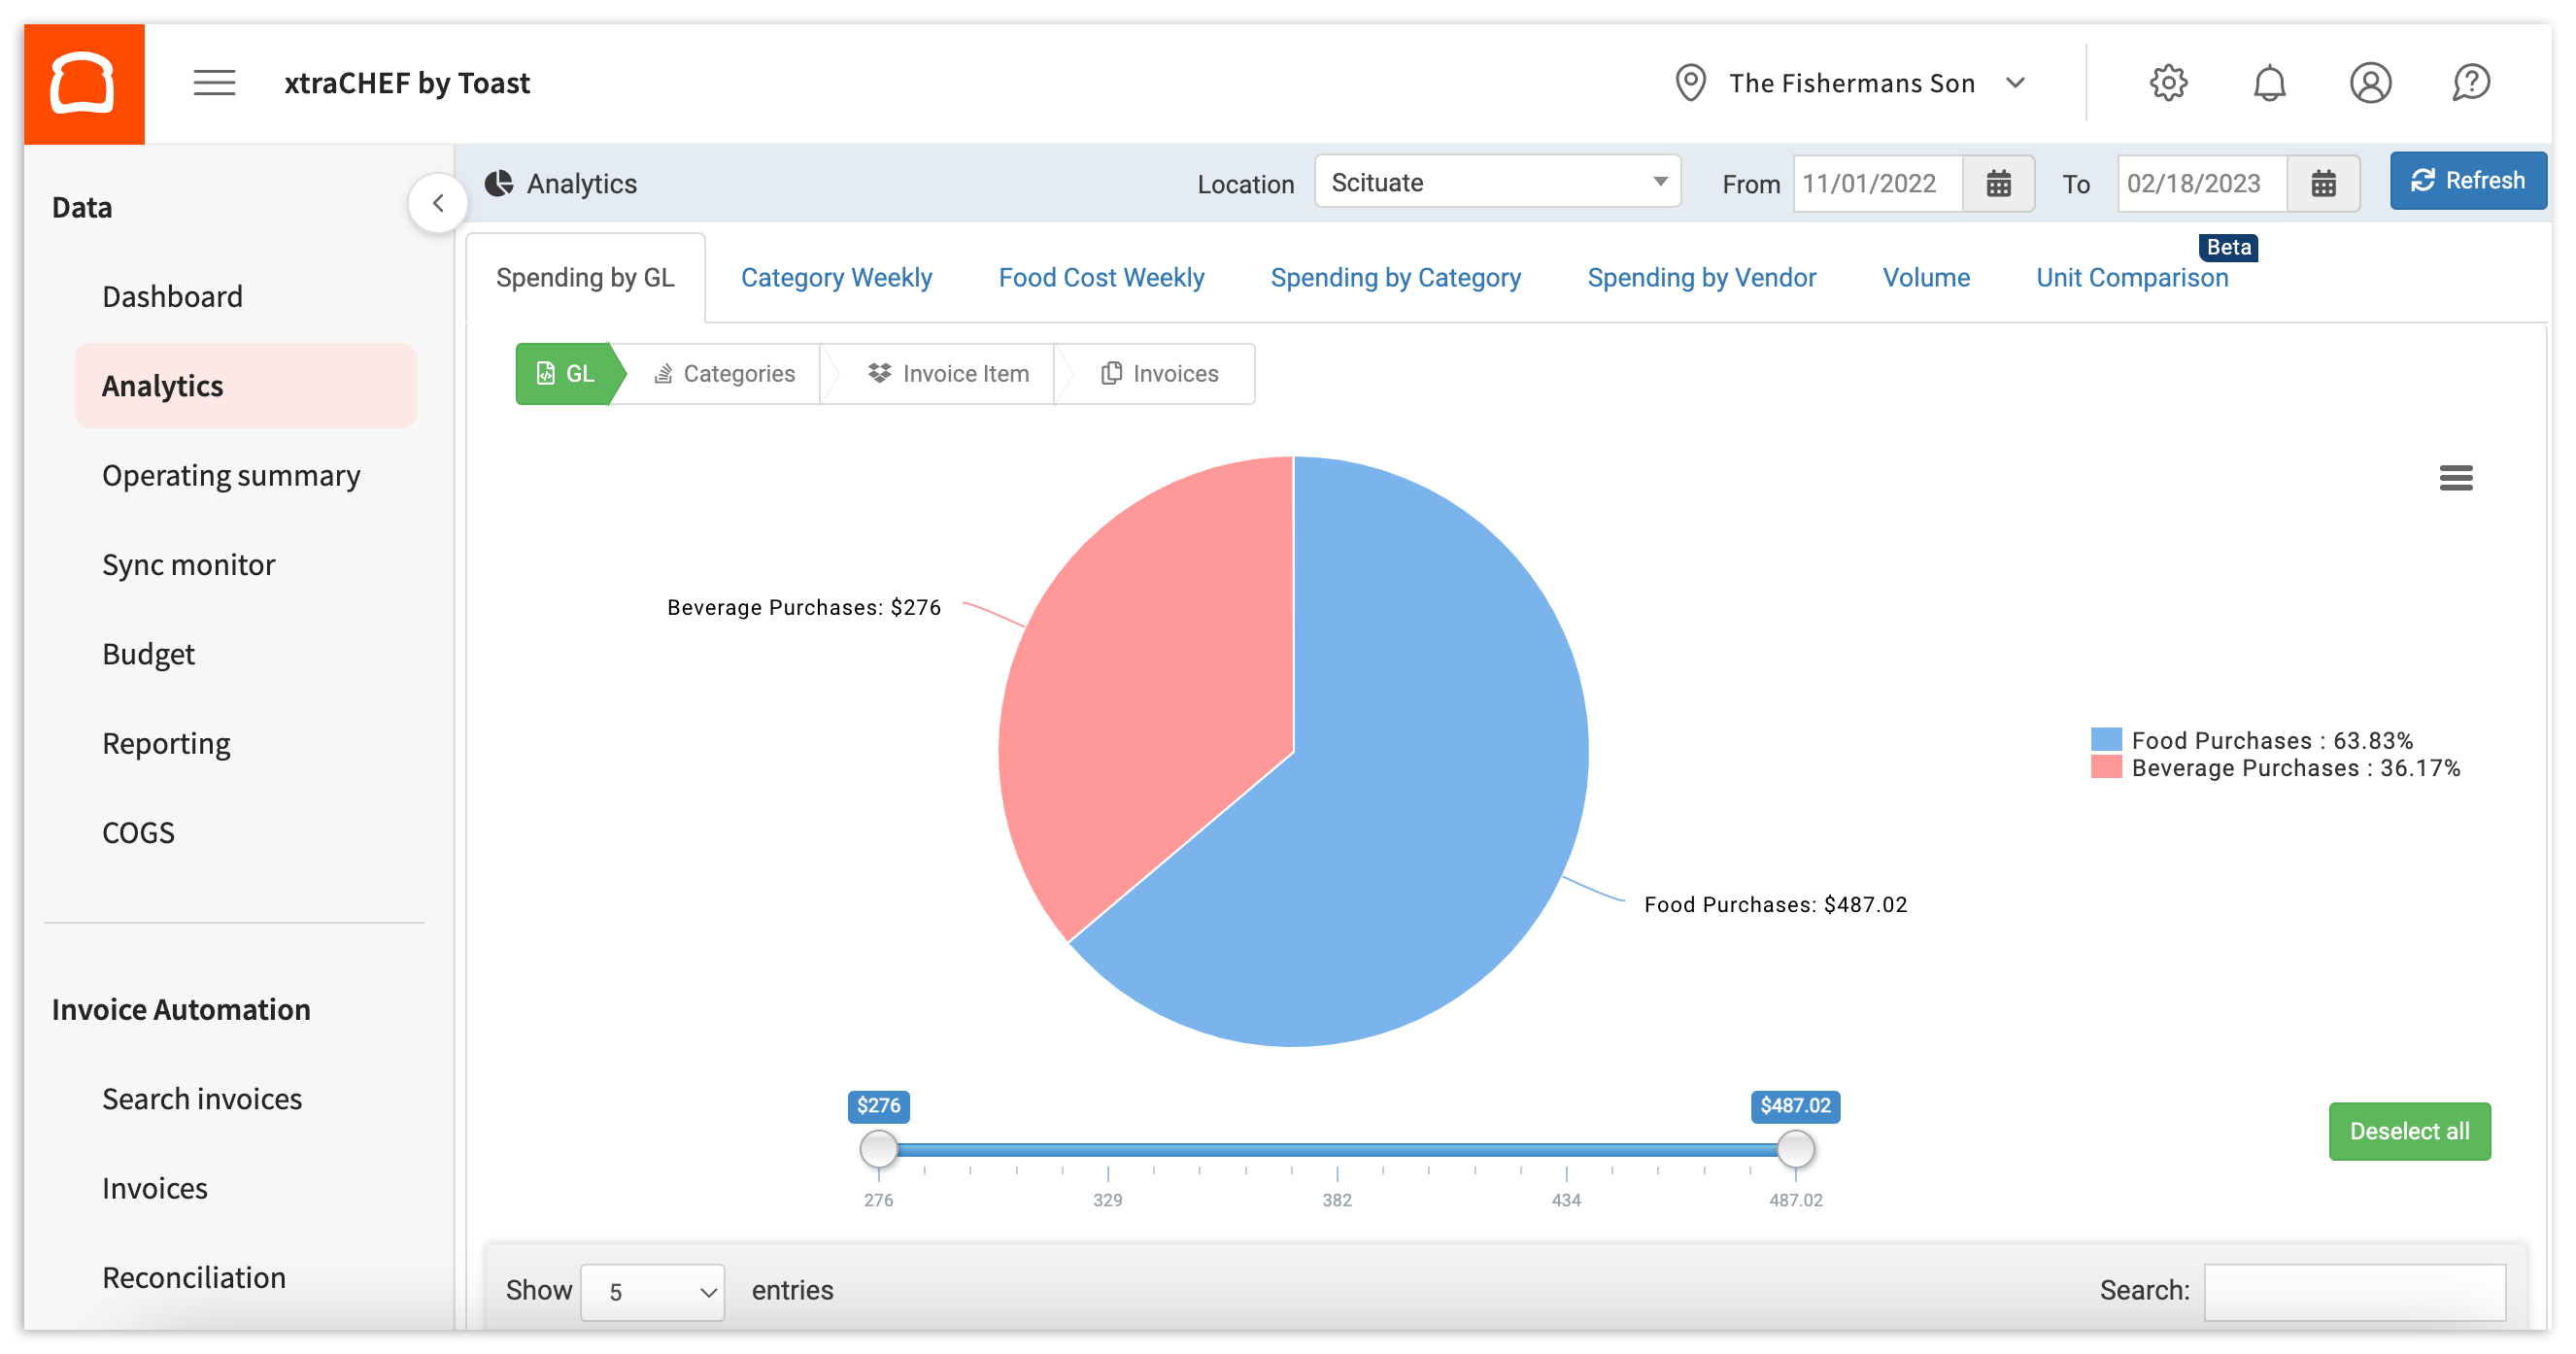
If you utilize sub-categories within your GL codes, you can dive even further into your spending. Read xtraCHEF: Get Started With Spending by GL Analytics for more information.
Category Weekly
Category Weekly is similar to Spending by GL and Spending by Category in that it breaks out your spending. That said, this particular report allows you to monitor and compare spending trends side by side on a week-to-week basis.
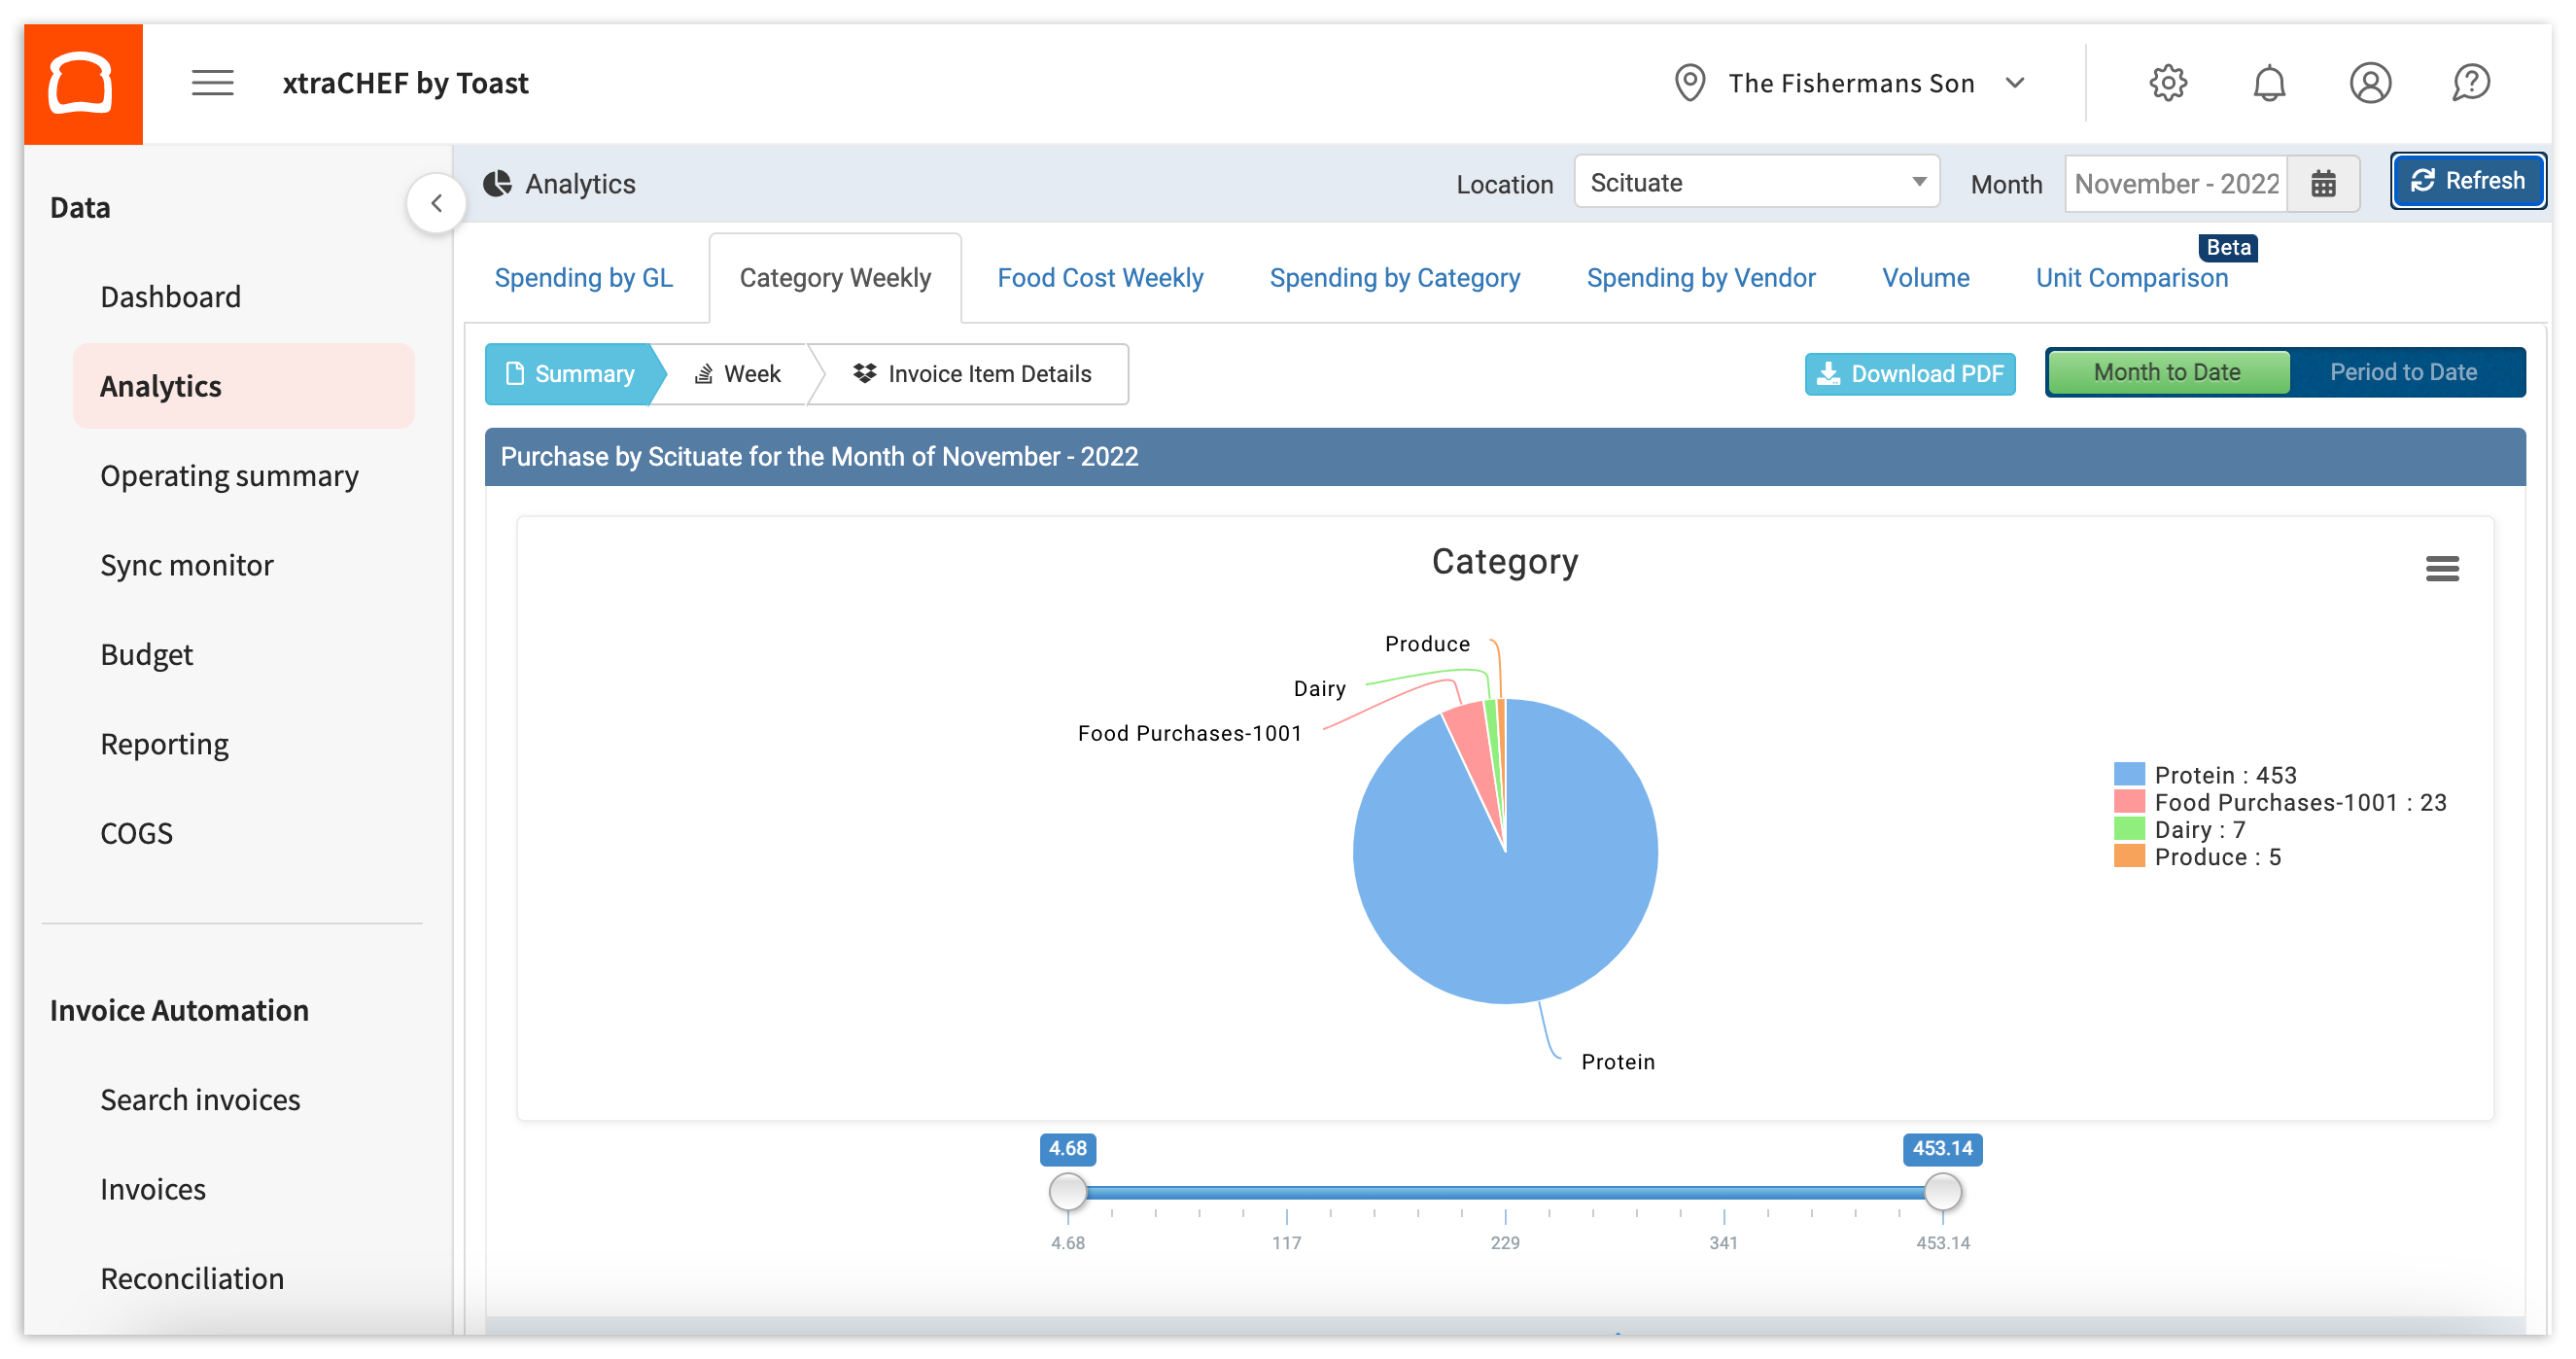
To learn more, check out xtraCHEF: Get Started With Category Weekly Analytics.
Food Cost Weekly
Food Cost Weekly goes beyond just purchases. If you have completed COGS Mapping, an important configuration step, this report allows you to quickly view a breakdown of your spending and sales by Cost Of Goods Sold (COGS) group and dive into the relationship between the two.
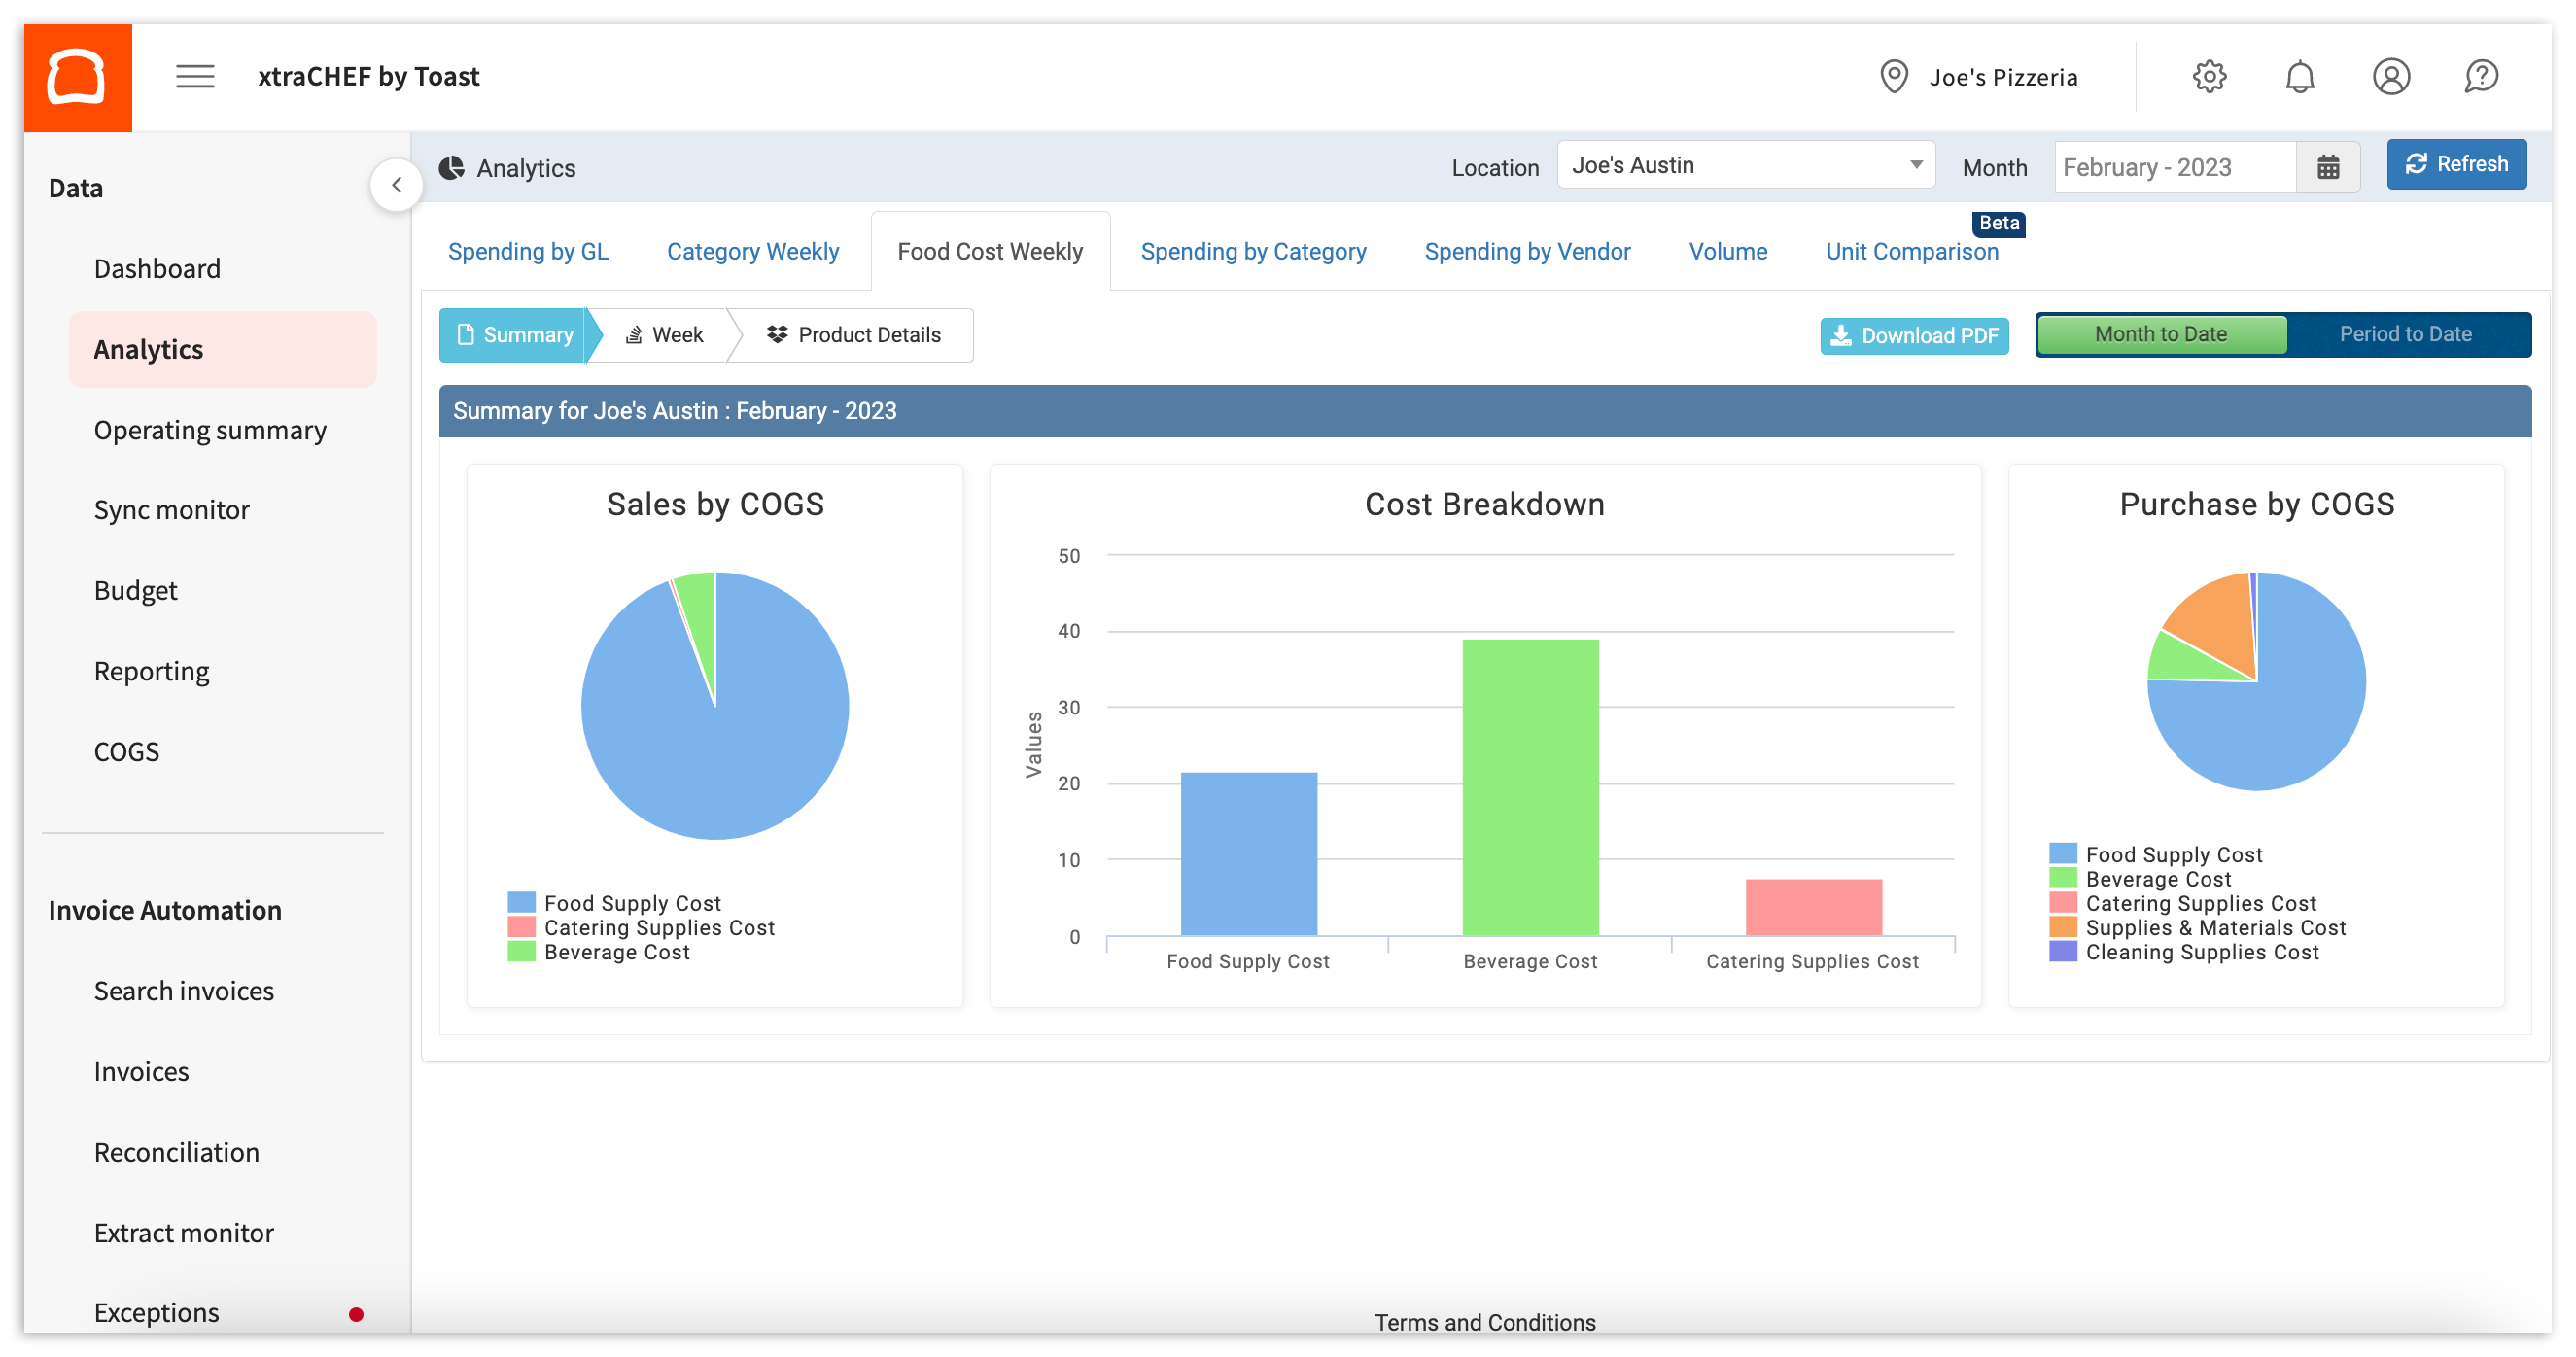
To learn more about this report, visit xtraCHEF: Get Started With Food Cost Weekly Analytics.
Spending by Category
Similar to Spending by GL, this report breaks out your spending by category.
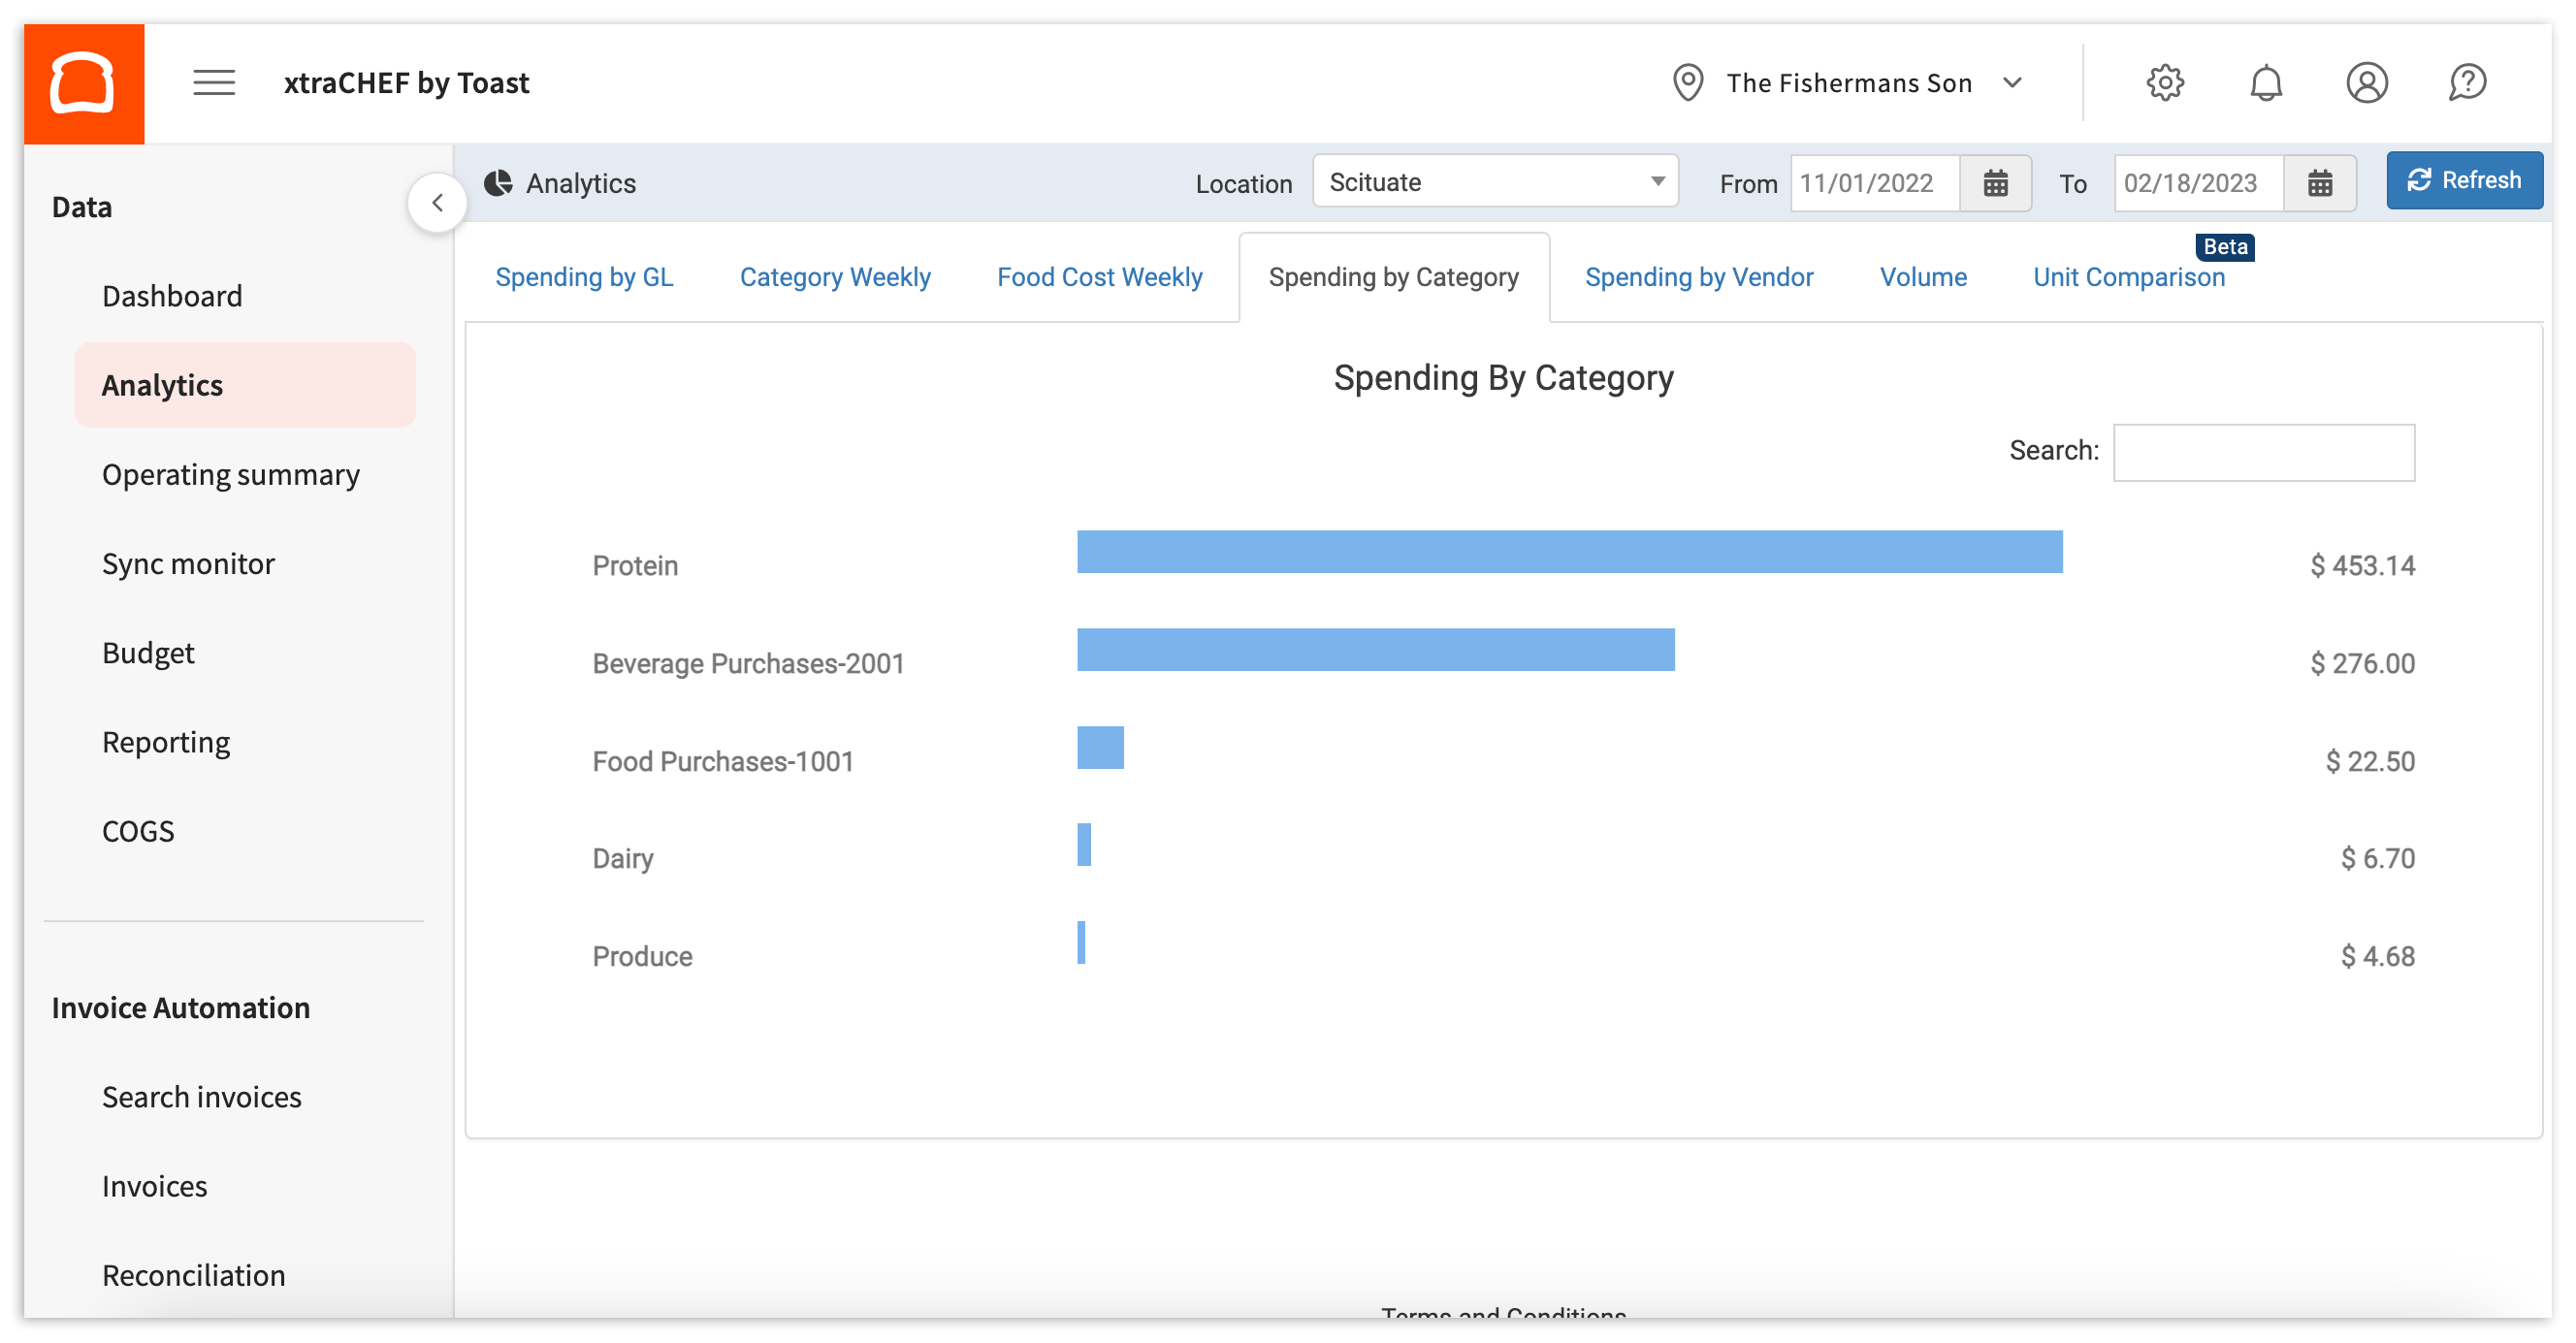
xtraCHEF: Get Started With Spending by Category Analytics offers more information about this report.
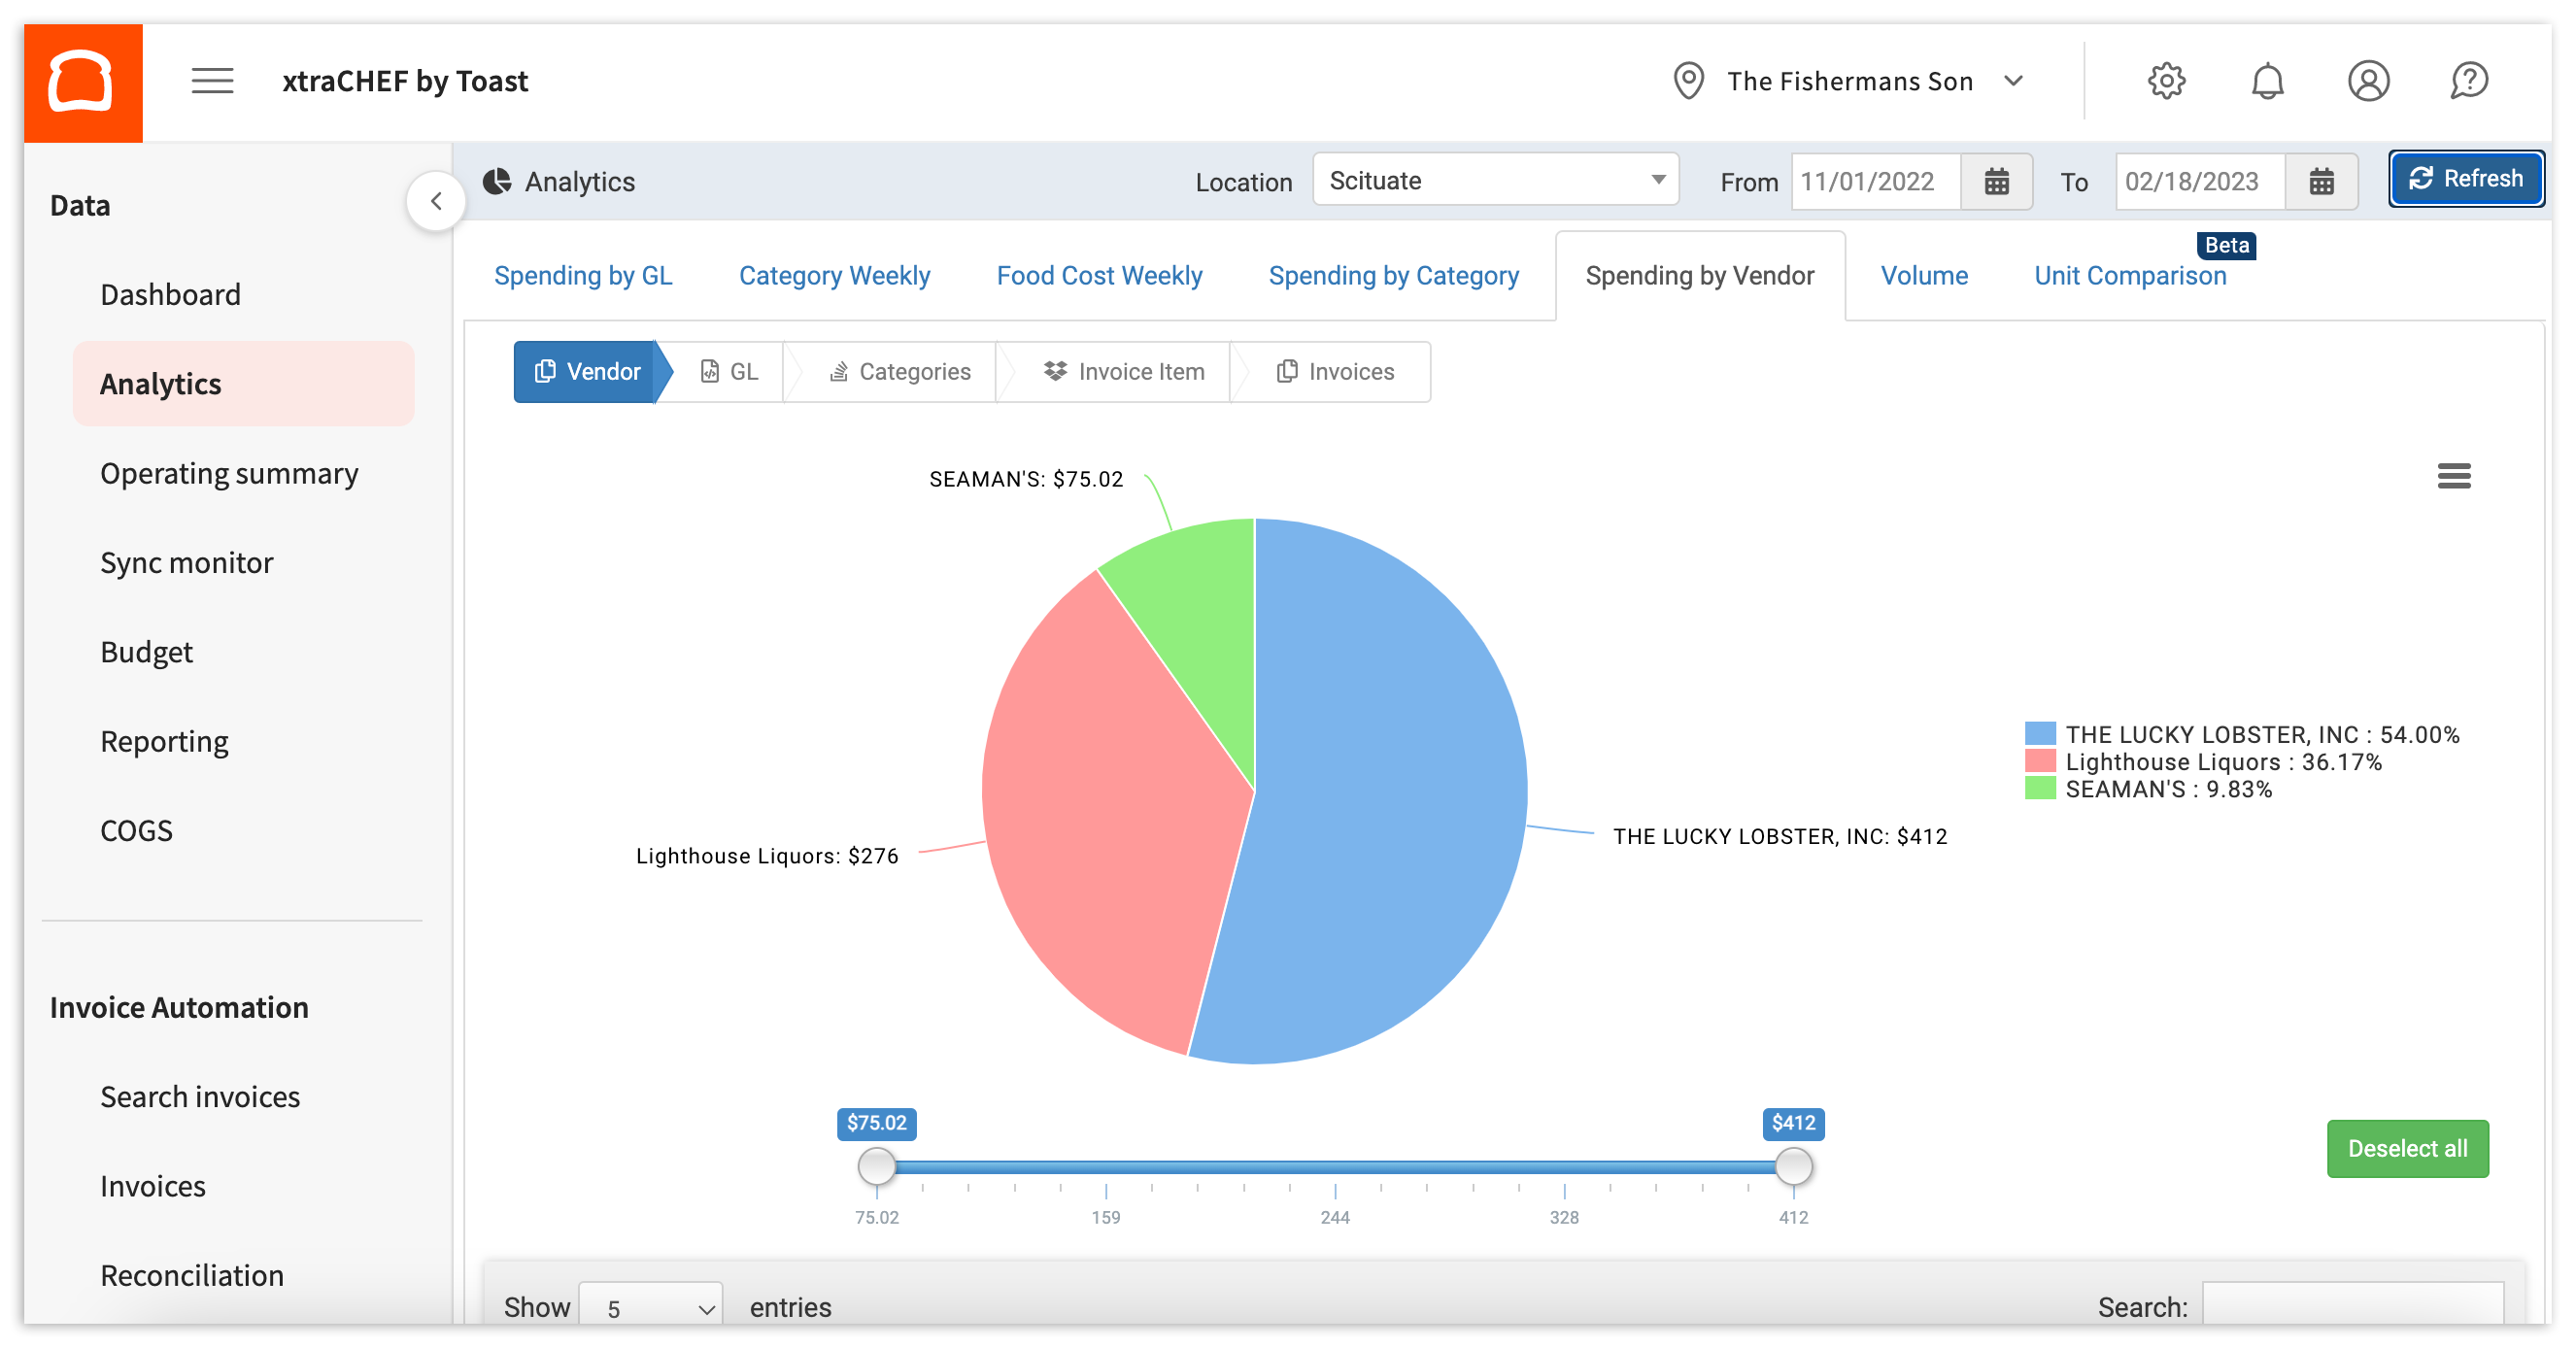
Spending by Vendor
This report breaks out your spending by vendor between a set date range. Here, you can monitor or explore which vendors you spend the most with and the GL codes, categories, and invoice items that eat up the majority of those expenses.
You can learn more by checking out xtraCHEF: Get Started With Spending by Vendor Analytics.
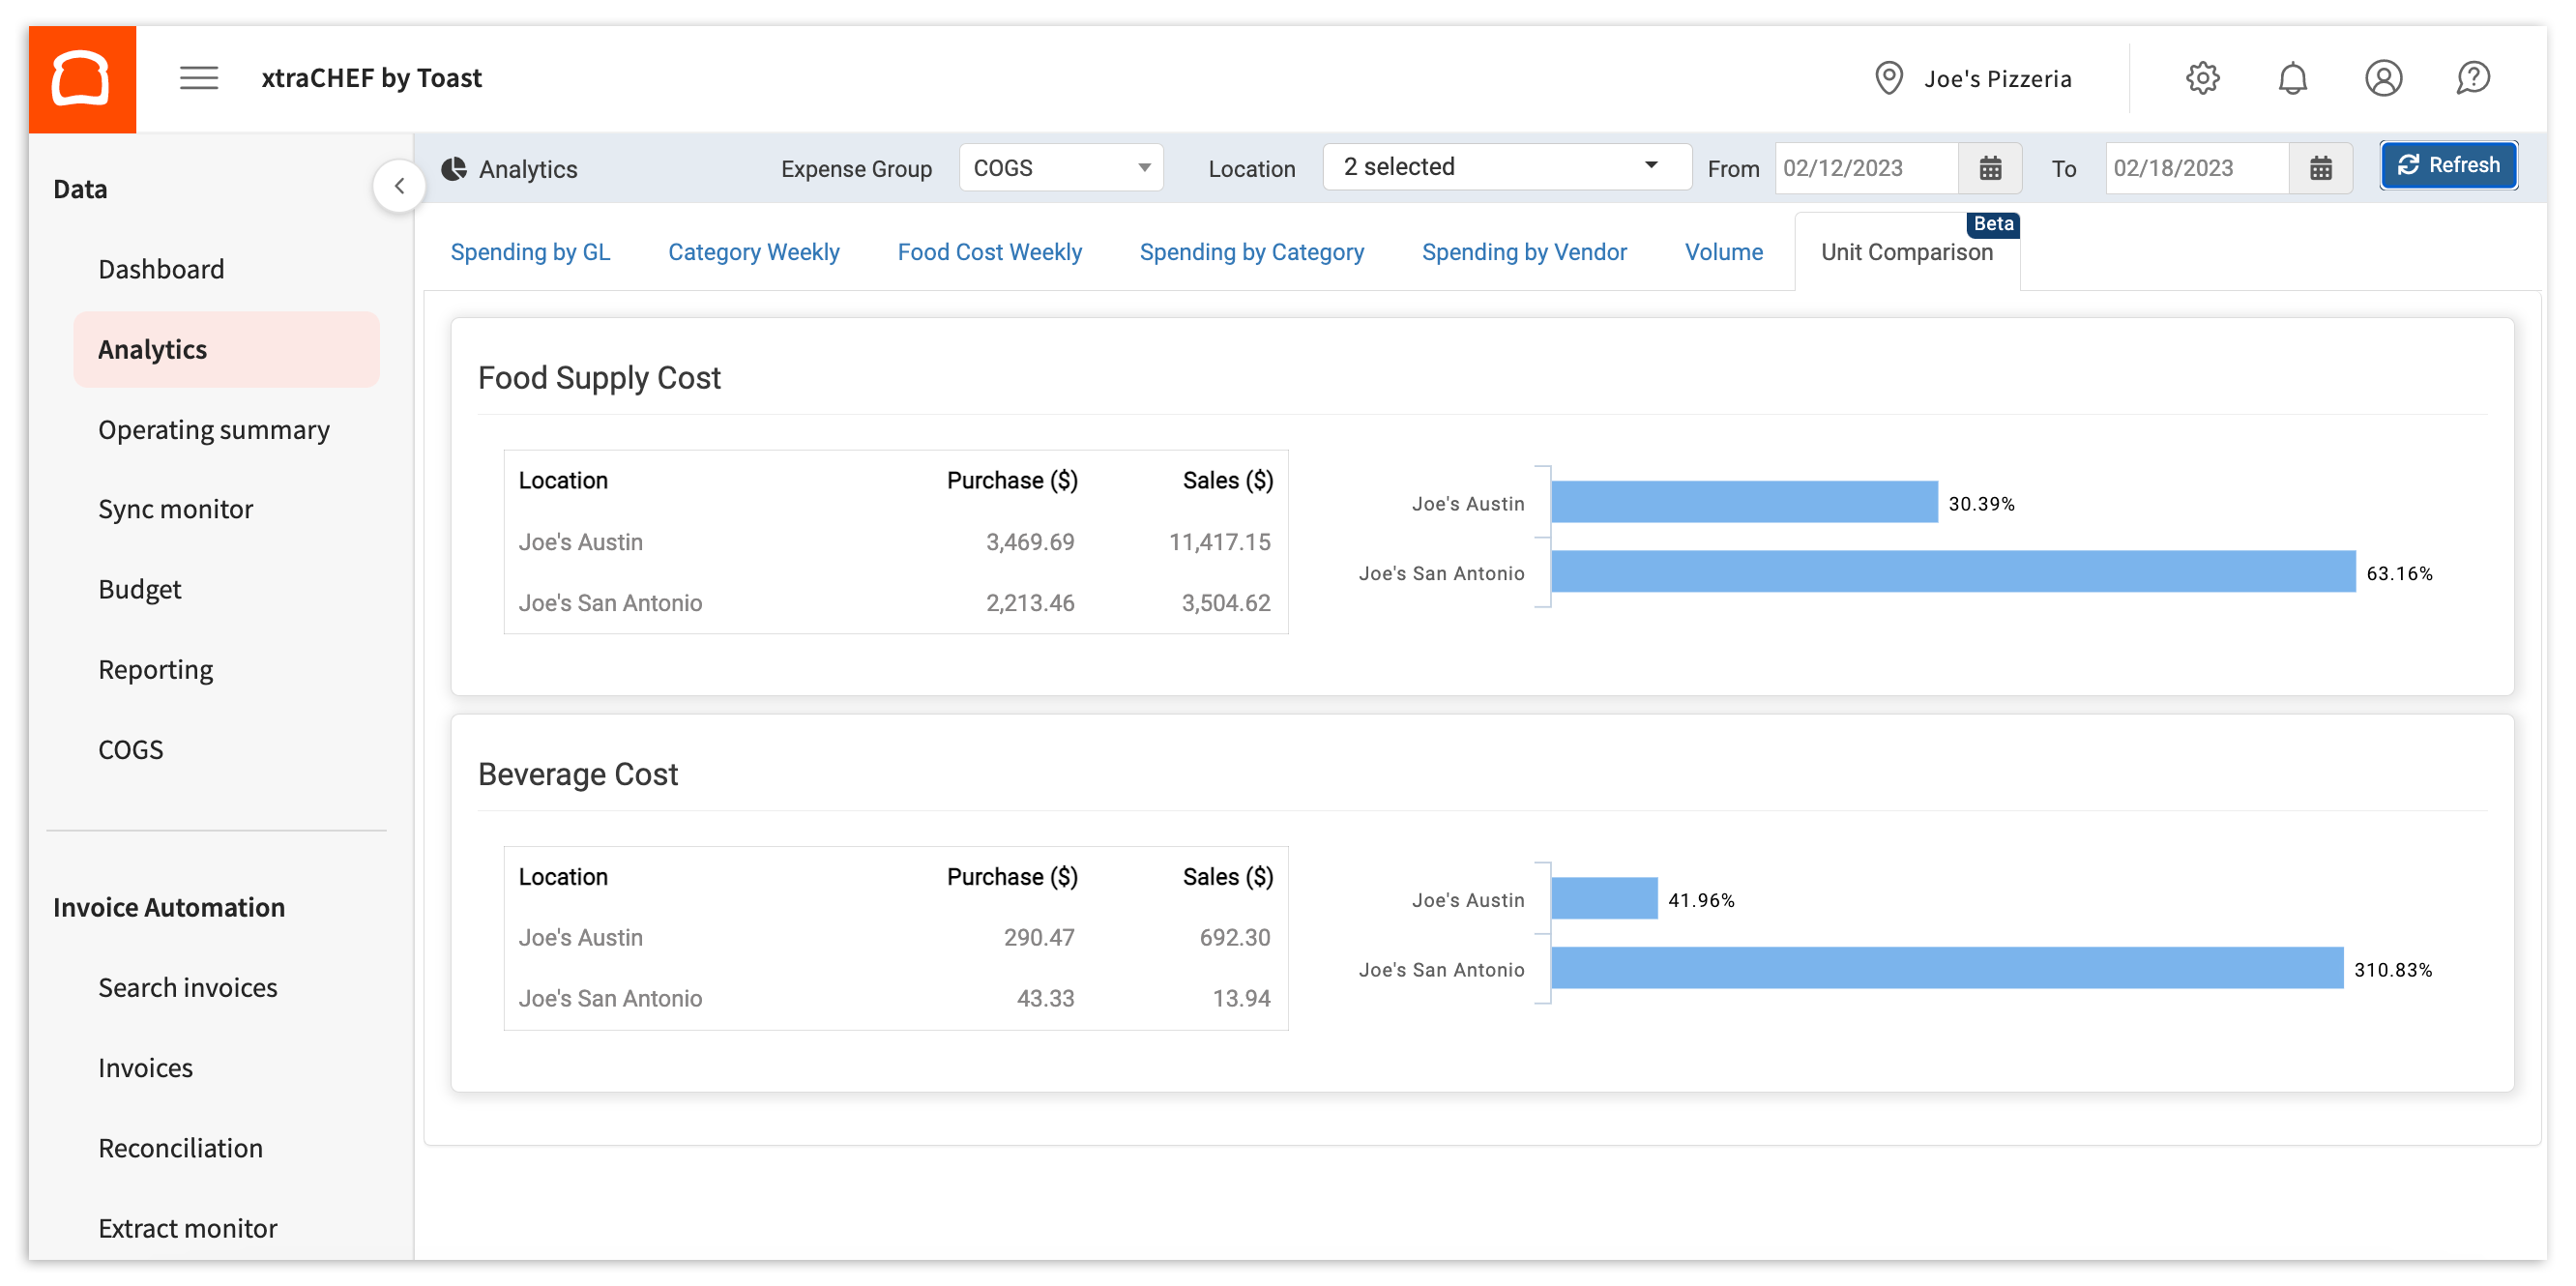
Unit Comparison
This analytics set is particularly beneficial if you have more than one location under your xtraCHEF account. Unit Comparison allows you to compare your spending by location and see how your individual restaurants stack up against one another.
For more information, check out xtraCHEF: Get Started With Unit Comparison Analytics.
Back to top
Additional Resources
- xtraCHEF: Review Reports in the Reporting Module
- xtraCHEF: Get Started With Cost Management Reports
- xtraCHEF: Get Started With Cost Visualization Reports