xtraCHEF: Primeros pasos con los informes de gestión de costos
Última actualización: 28 abr 2026, 4:19 p.m.
- Resumen de informes de gestión de costos
- Variación de precio contratada
- Costo de los bienes vendidos (COGS)
- Resumen de operaciones
- Comparación de fluctuaciones de precios
- Rastreador de precios
- Artículos comprados
- Comparación de precios de proveedores
- Recursos adicionales
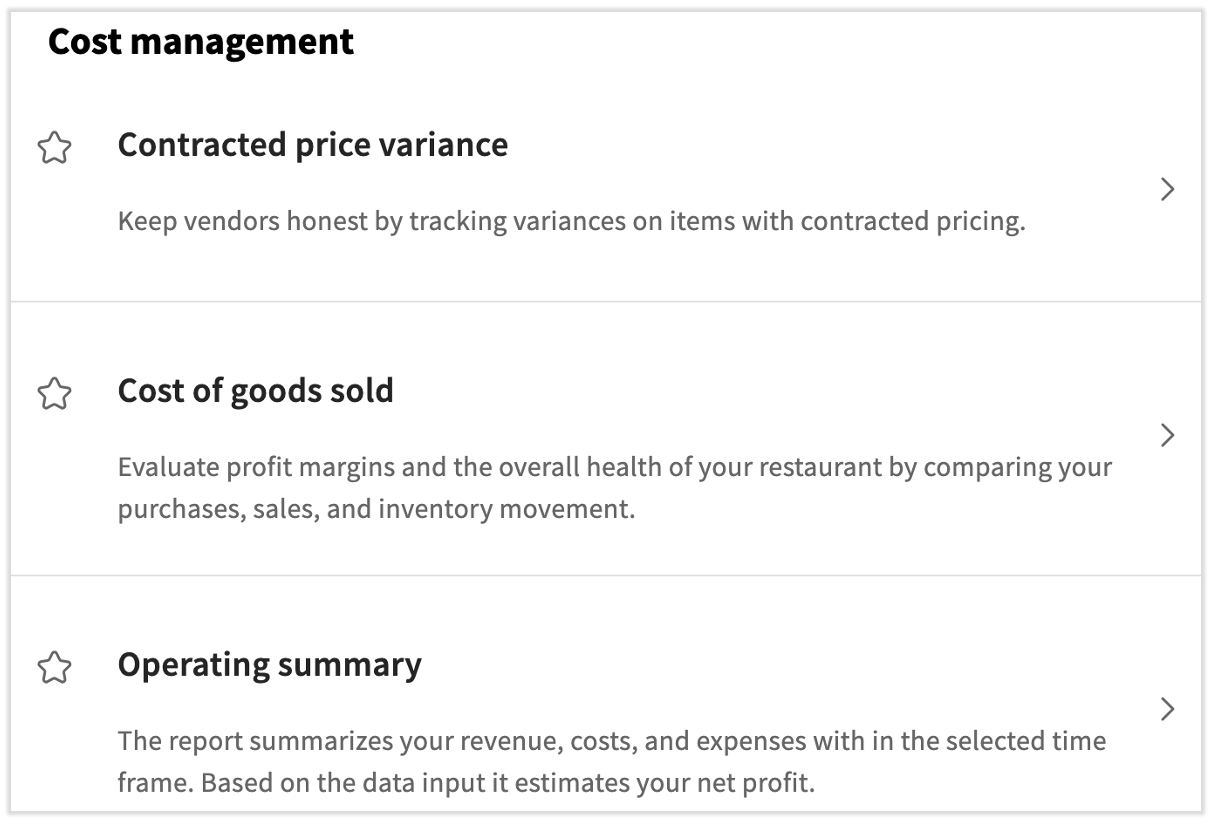
Resumen de informes de gestión de costos
Los informes de gestión de costos brindan información sobre diferentes gastos y costos, y te ayudan a controlar el gasto. Para acceder a tus informes de gestión de costos, ve a Informes en la barra de navegación de xtraCHEF. La primera sección de la página está dedicada a los informes de gestión de costos. Selecciona el ícono de estrella para resaltar un informe y guardarlo en el menú de favoritos a tu izquierda.
A diciembre de 2024, hay algunos informes nuevos en esta sección. Además del informe de variación de precios contractuales y la comparación de fluctuación de precios, también verás el informe de costo de los productos vendidos (COGS), el resumen operativo, el rastreador de precios, el informe de artículos comprados y la comparación de precios de proveedores. Se eliminaron el informe de relación de costo de los alimentos y el informe de compra de los 100 productos principales.
Variación de precio contratada
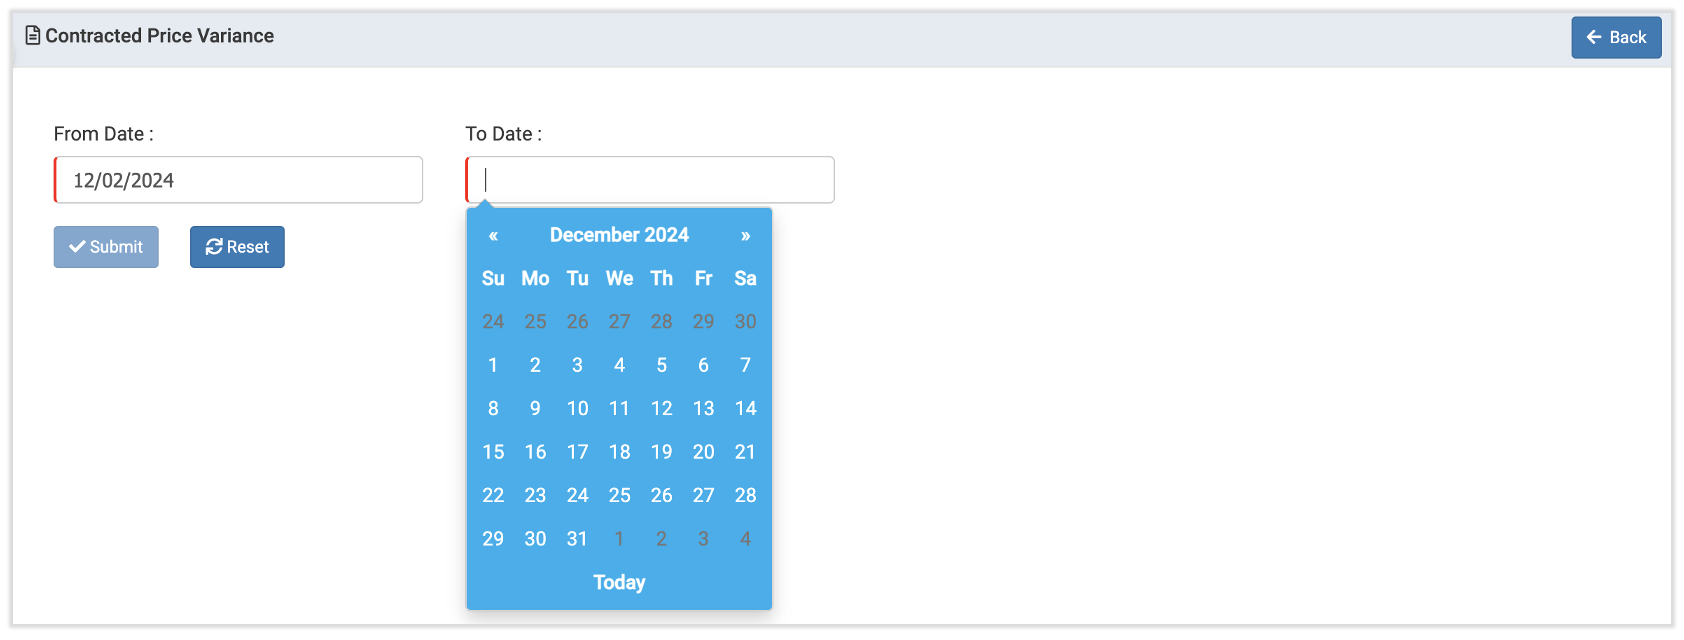
El primer informe es la variación del precio pactada. Para aprovechar al máximo este informe, deberás haber configurado un precio contractual para uno o más de tus artículos. Si tienes todo listo para ver el informe de variación de precios contratado, elige el rango de fechas y selecciona Enviar.
Se abrirá un registro de todas las horas en que los precios hayan fluctuado por encima o por debajo de tu número de contrato original dentro del rango de fechas especificado. Encontrarás qué ubicaciones se vieron afectadas, los nombres del proveedor, la fecha de la factura y el código o descripción del artículo de la factura. Esto te da la visión más completa de cuán generalizadas son las variaciones de precios dentro de tu organización.
Es importante tener en cuenta que las variaciones no son necesariamente malas por definición. Es posible que hayas encontrado que los precios disminuyeron con respecto a lo que contrataste. Tu informe de variación de precios contractual proporciona información sencilla al enumerar el precio del contrato junto al precio de compra final e incluye el cambio de precio reflejado tanto en dólares como en porcentaje de los costos totales. Usa estos datos para anticiparte a los cambios en la demanda, recortar gastos innecesarios y Omitir responsabilidades a los proveedores.
Costo de los bienes vendidos (COGS)
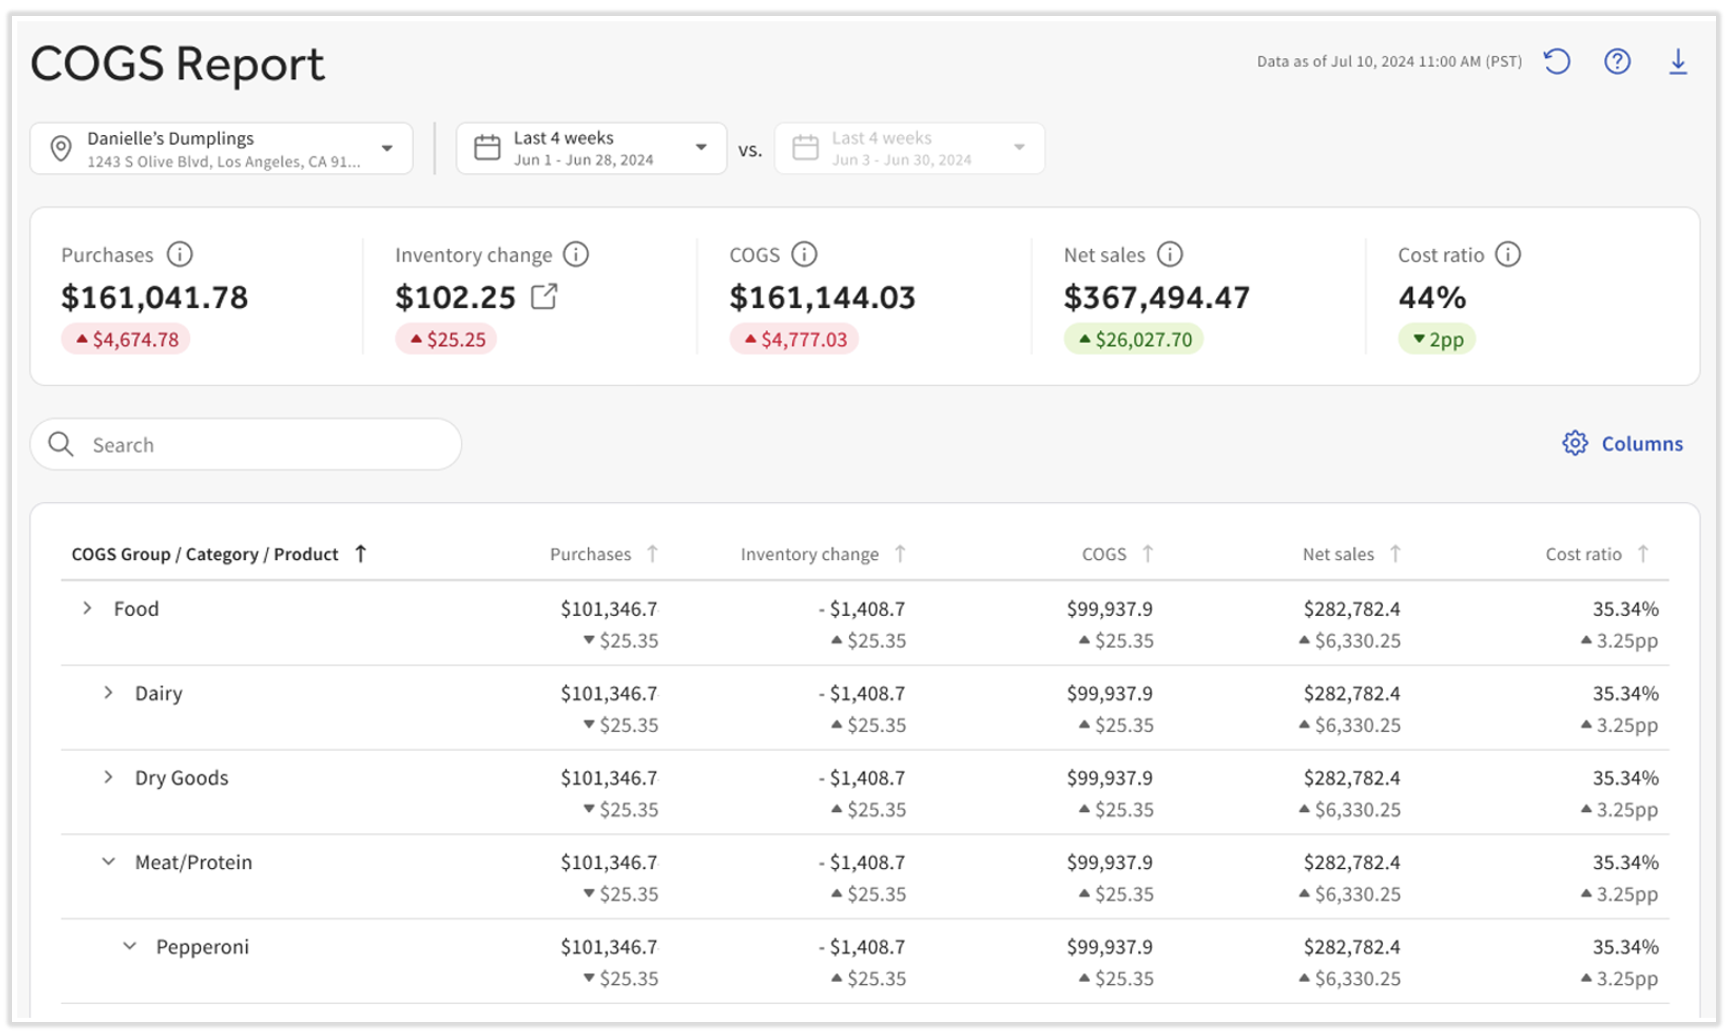
El informe de costo de los productos vendidos (COGS) es una herramienta común que se utiliza para determinar los márgenes de ganancia de los productos que usas. Para sacar el máximo provecho de este informe, debes seguir algunos pasos para configurar períodos contables, asignar ventas y categorías a grupos de COGS, y agregar valores de inventario. Una vez completado, podrás ver cómo se mueven tus productos por tu restaurante y qué significa eso para tus resultados finales. Visita xtraCHEF: Informe de COGS para conocer todos estos pasos y la información que puedes recopilar de este informe.
Resumen operativo
El resumen operativo compara tus ganancias y pérdidas con tu presupuesto para obtener ganancias netas. Este informe se incluye aquí, pero también tiene su propia pestaña en el menú de navegación de la izquierda. Revisar xtraCHEF: Resumen operativo para comenzar el proceso de configuración y aprender cómo usar este informe.
Comparación de fluctuaciones de precios
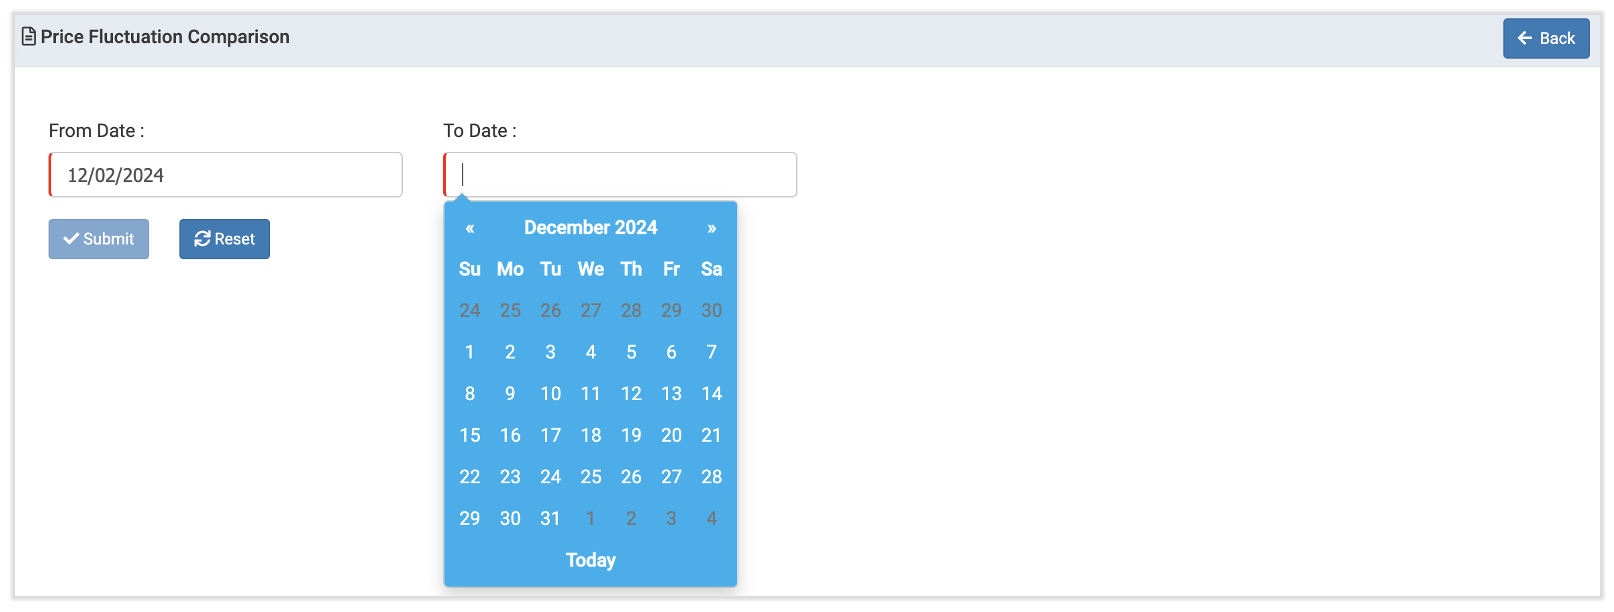
Usa tu informe de comparación de fluctuaciones de precios para comprender cómo pueden variar los precios de los mismos artículos entre tus ubicaciones. Para ver tus datos de comparación de fluctuaciones de precios, selecciona este informe entre tus opciones de informe. Especifica un rango de fechas y selecciona Enviar.
Cualquier artículo de la factura comprado en todas tus ubicaciones de xtraCHEF se incorporará automáticamente al informe.
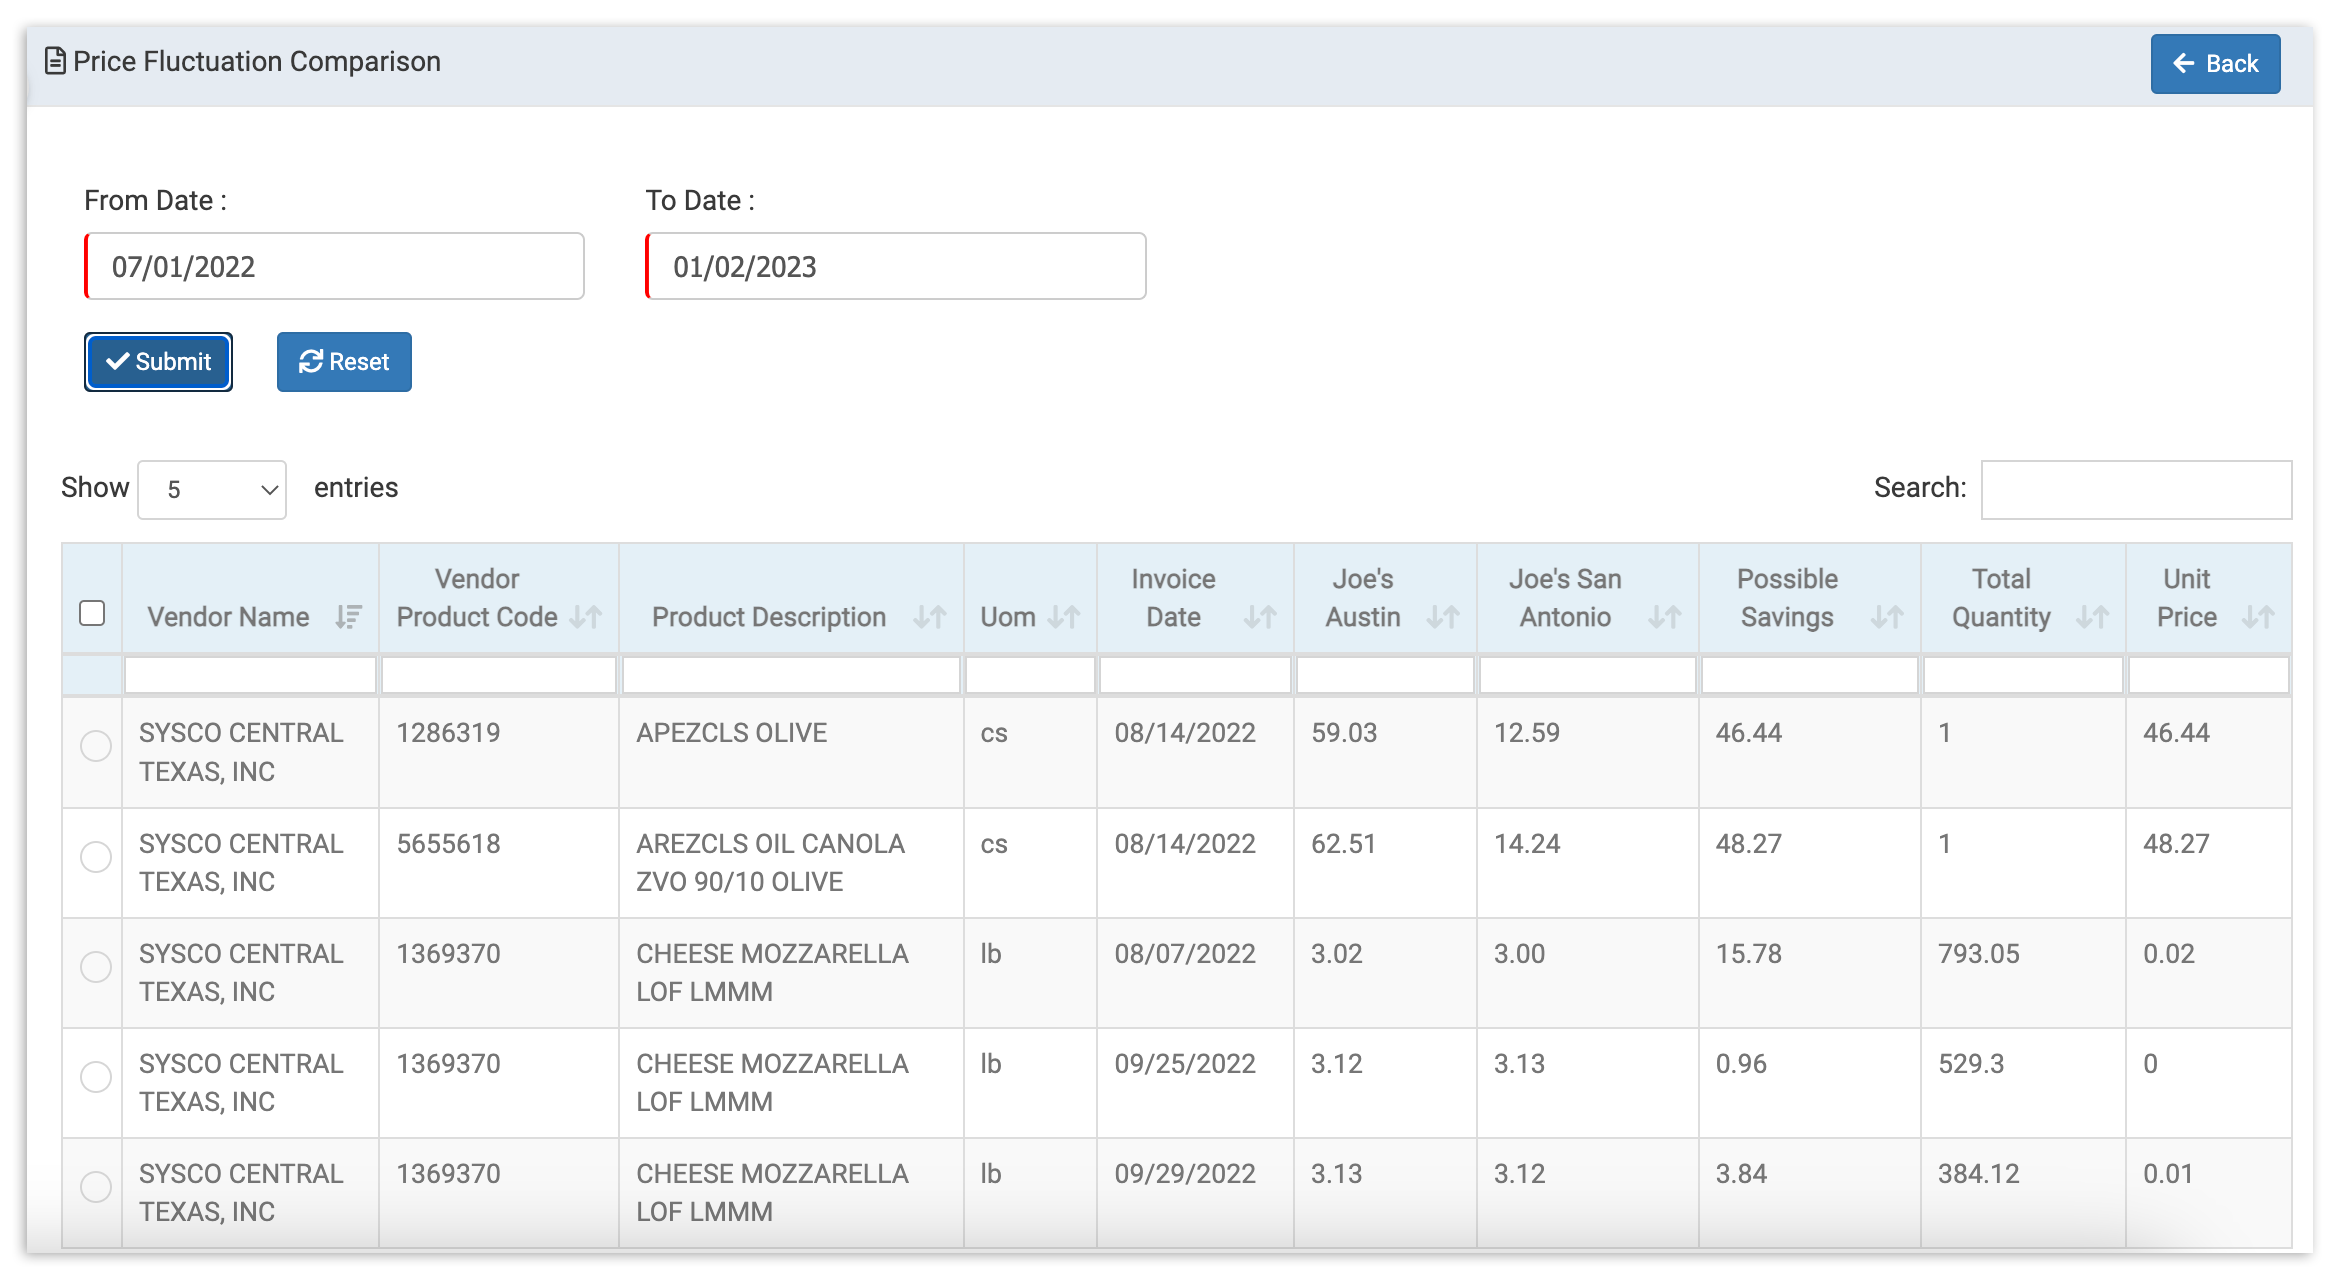
Al ejecutar este informe, notarás que el cuadro de comparación de fluctuaciones de precios lista el proveedor, el artículo de la factura y las ubicaciones donde se entregó, junto con la fecha. Tus ubicaciones se enumerarán en orden alfabético. Para facilitar la consulta, la diferencia de precio entre las ubicaciones se expresa en dólares en la pestaña Posibles ahorros.
Haz un seguimiento de las discrepancias entre tus ubicaciones para comprender mejor cómo estas fluctuaciones pueden afectar tus costos y descubrir cualquier comportamiento potencialmente deshonesto antes de que se conviertan en disruptivas.
Volver arriba
Rastreador de precios
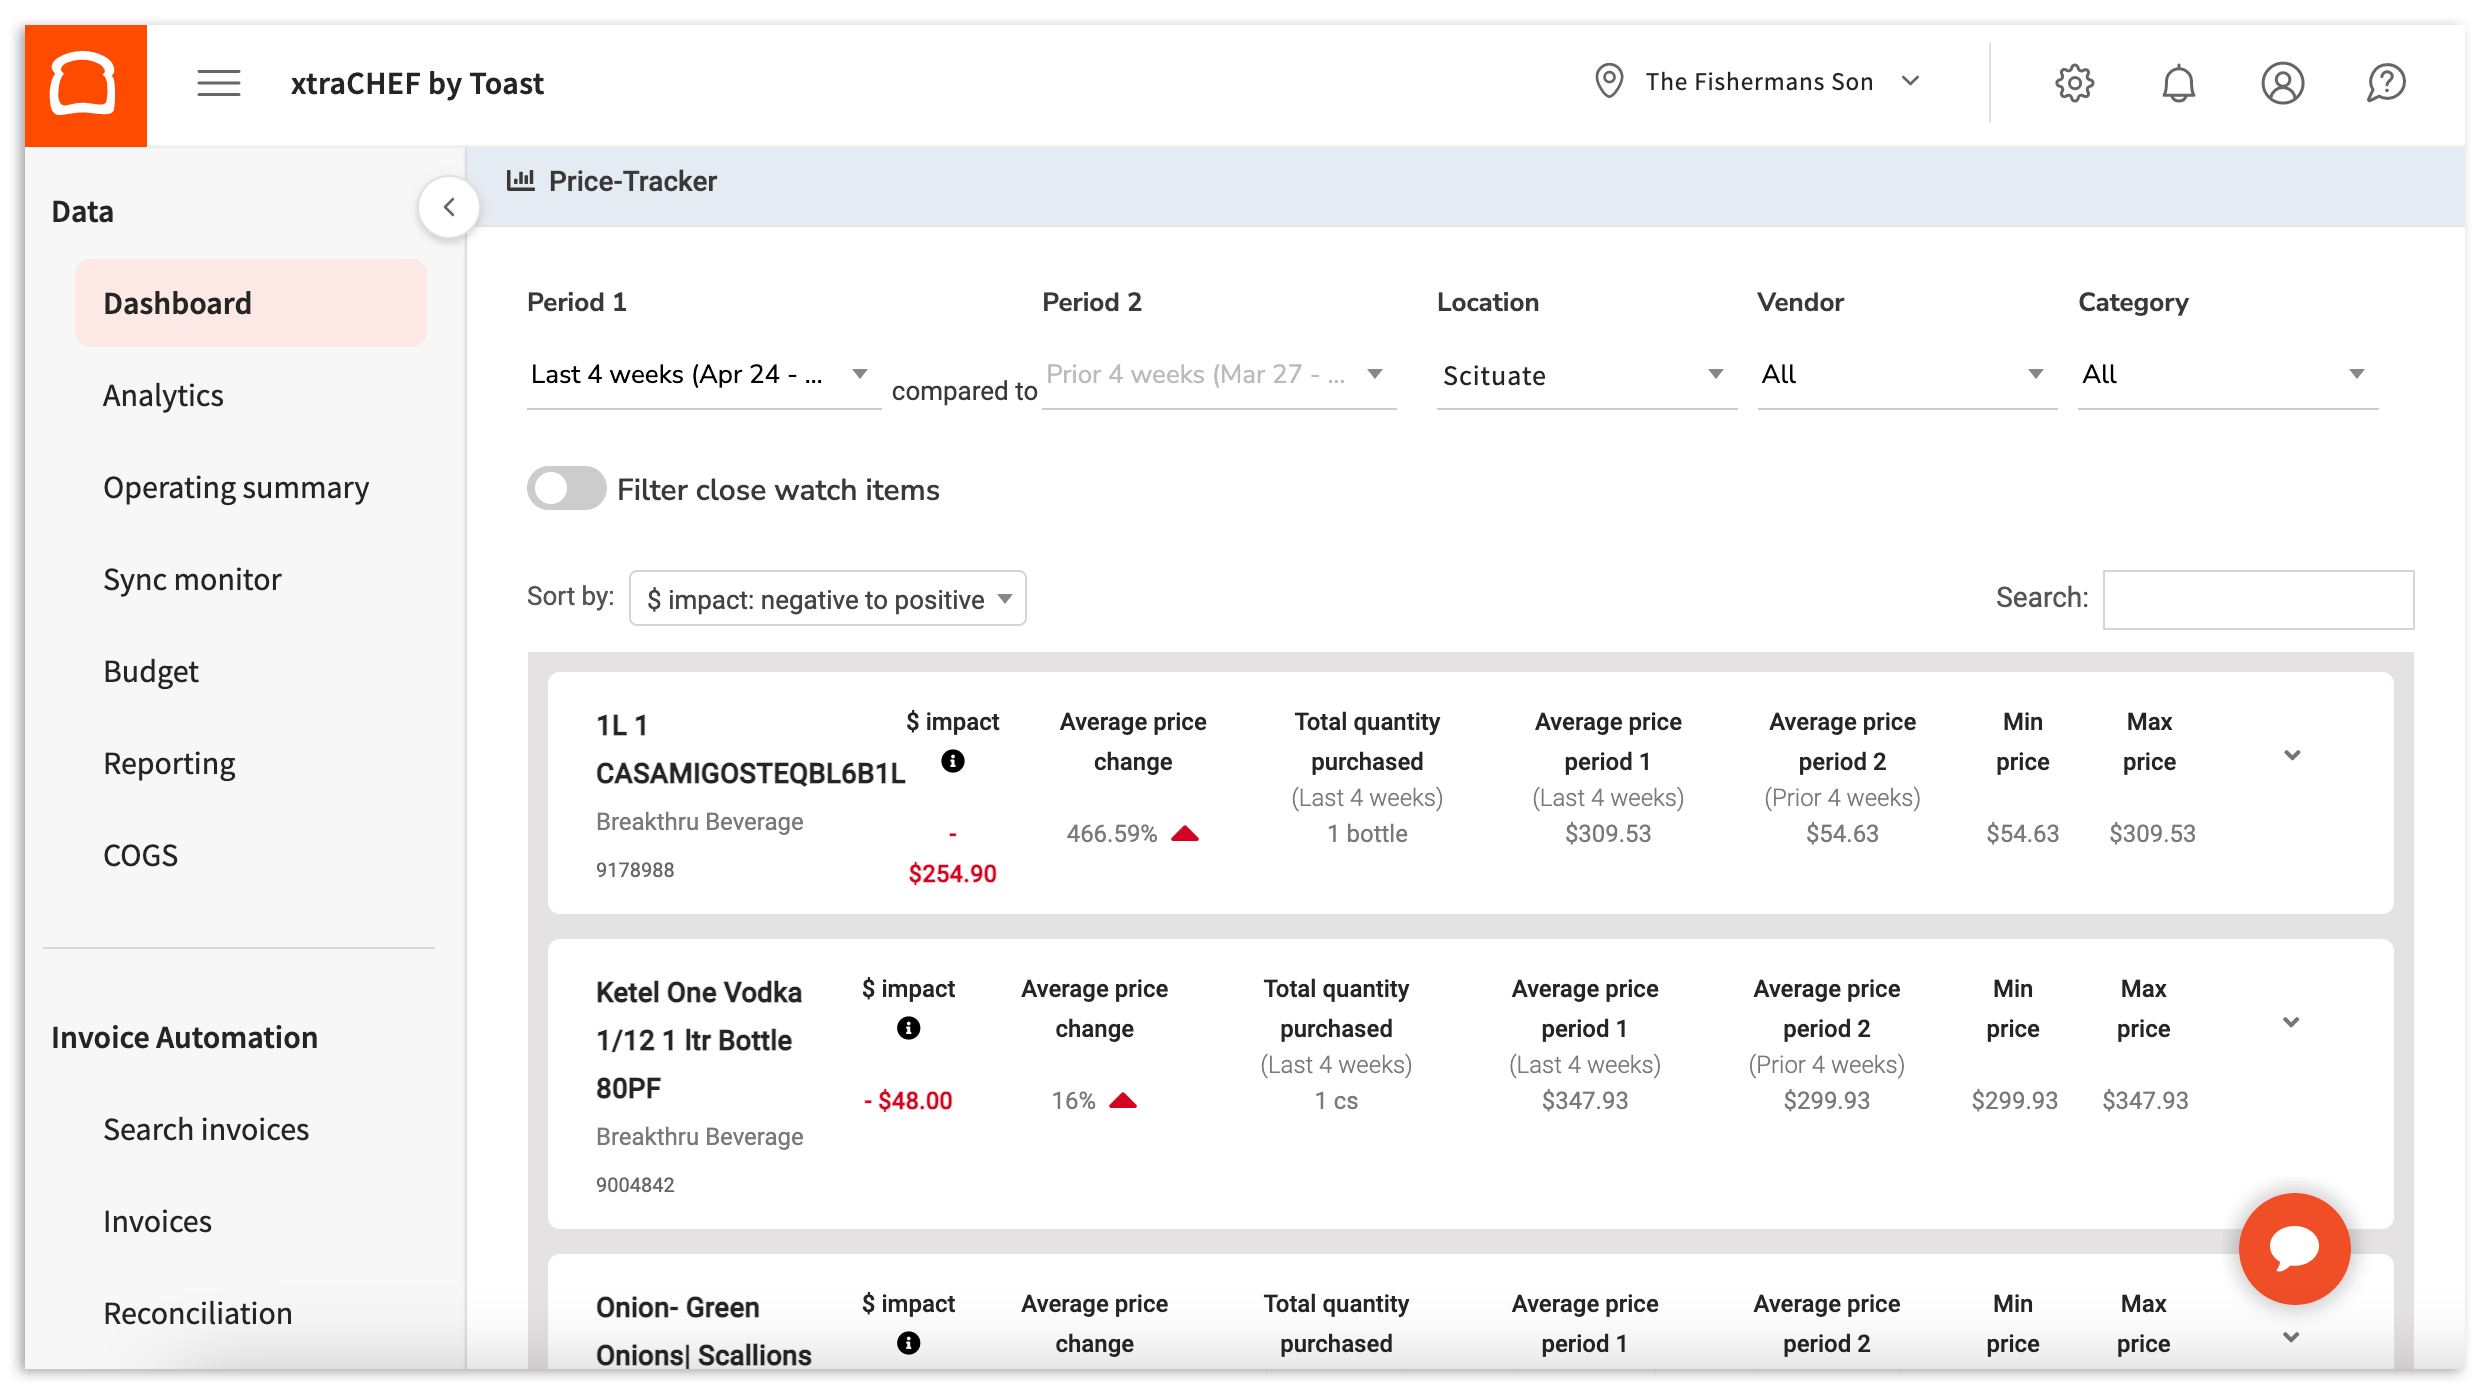
El rastreador de precios identifica cambios o variaciones de tus proveedores. Para comenzar, selecciona cualquiera o ninguno de los filtros disponibles en la parte superior (período 1, período de comparación 2, ubicación, proveedor y/o categoría. El rastreador de precios se actualizará de inmediato con los filtros que apliques.
Es posible que reconozcas este informe desde el mosaico de tu panel de xtraCHEF. Esta es otra herramienta a la que tienes acceso fuera de la sección Informes.
Artículos comprados
Obtén más información sobre tus gastos publicando un informe de artículos comprados. Como su nombre indica, este informe listará todos los artículos de facturas comprados dentro de los criterios especificados. Para comenzar, elige tu ubicación, rango de fechas (en un plazo de 90 días) y criterios de agrupación para asegurarte de obtener los datos más relevantes. Por último, selecciona Enviar para ver tu informe.
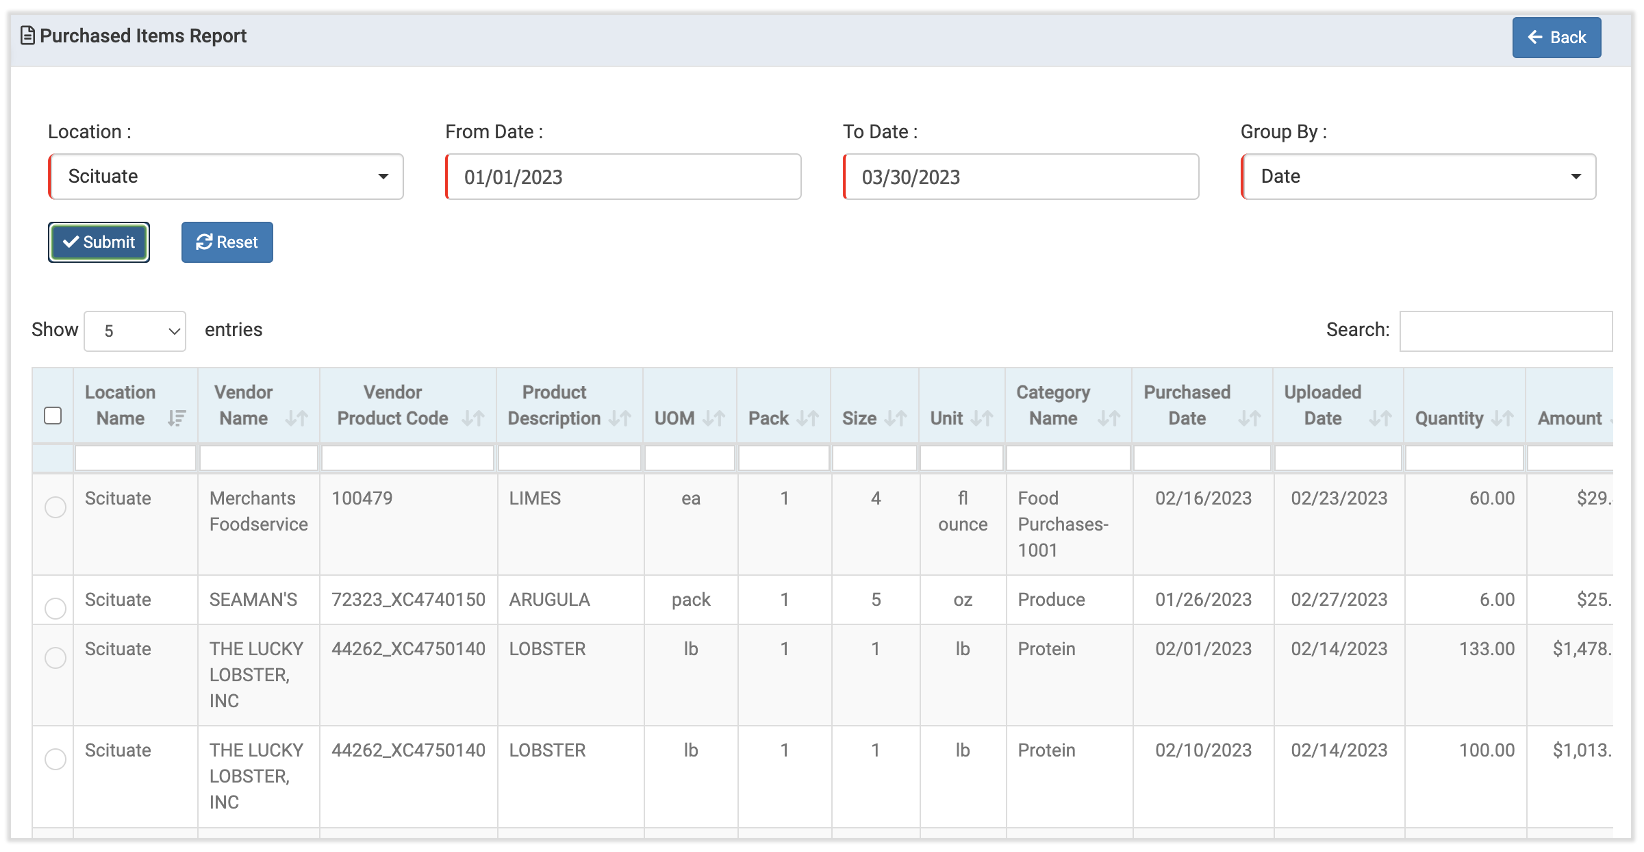
En el ejemplo anterior, podemos ver cada compra realizada en el Plato de dos meses. Esos datos se agrupan por ubicación, lo que te permite ver de qué proveedores obtiene más suministros la ubicación. Esto puede ayudar a tomar decisiones futuras sobre los contratos de proveedores o las negociaciones de precios.
Comparación de precios de proveedores
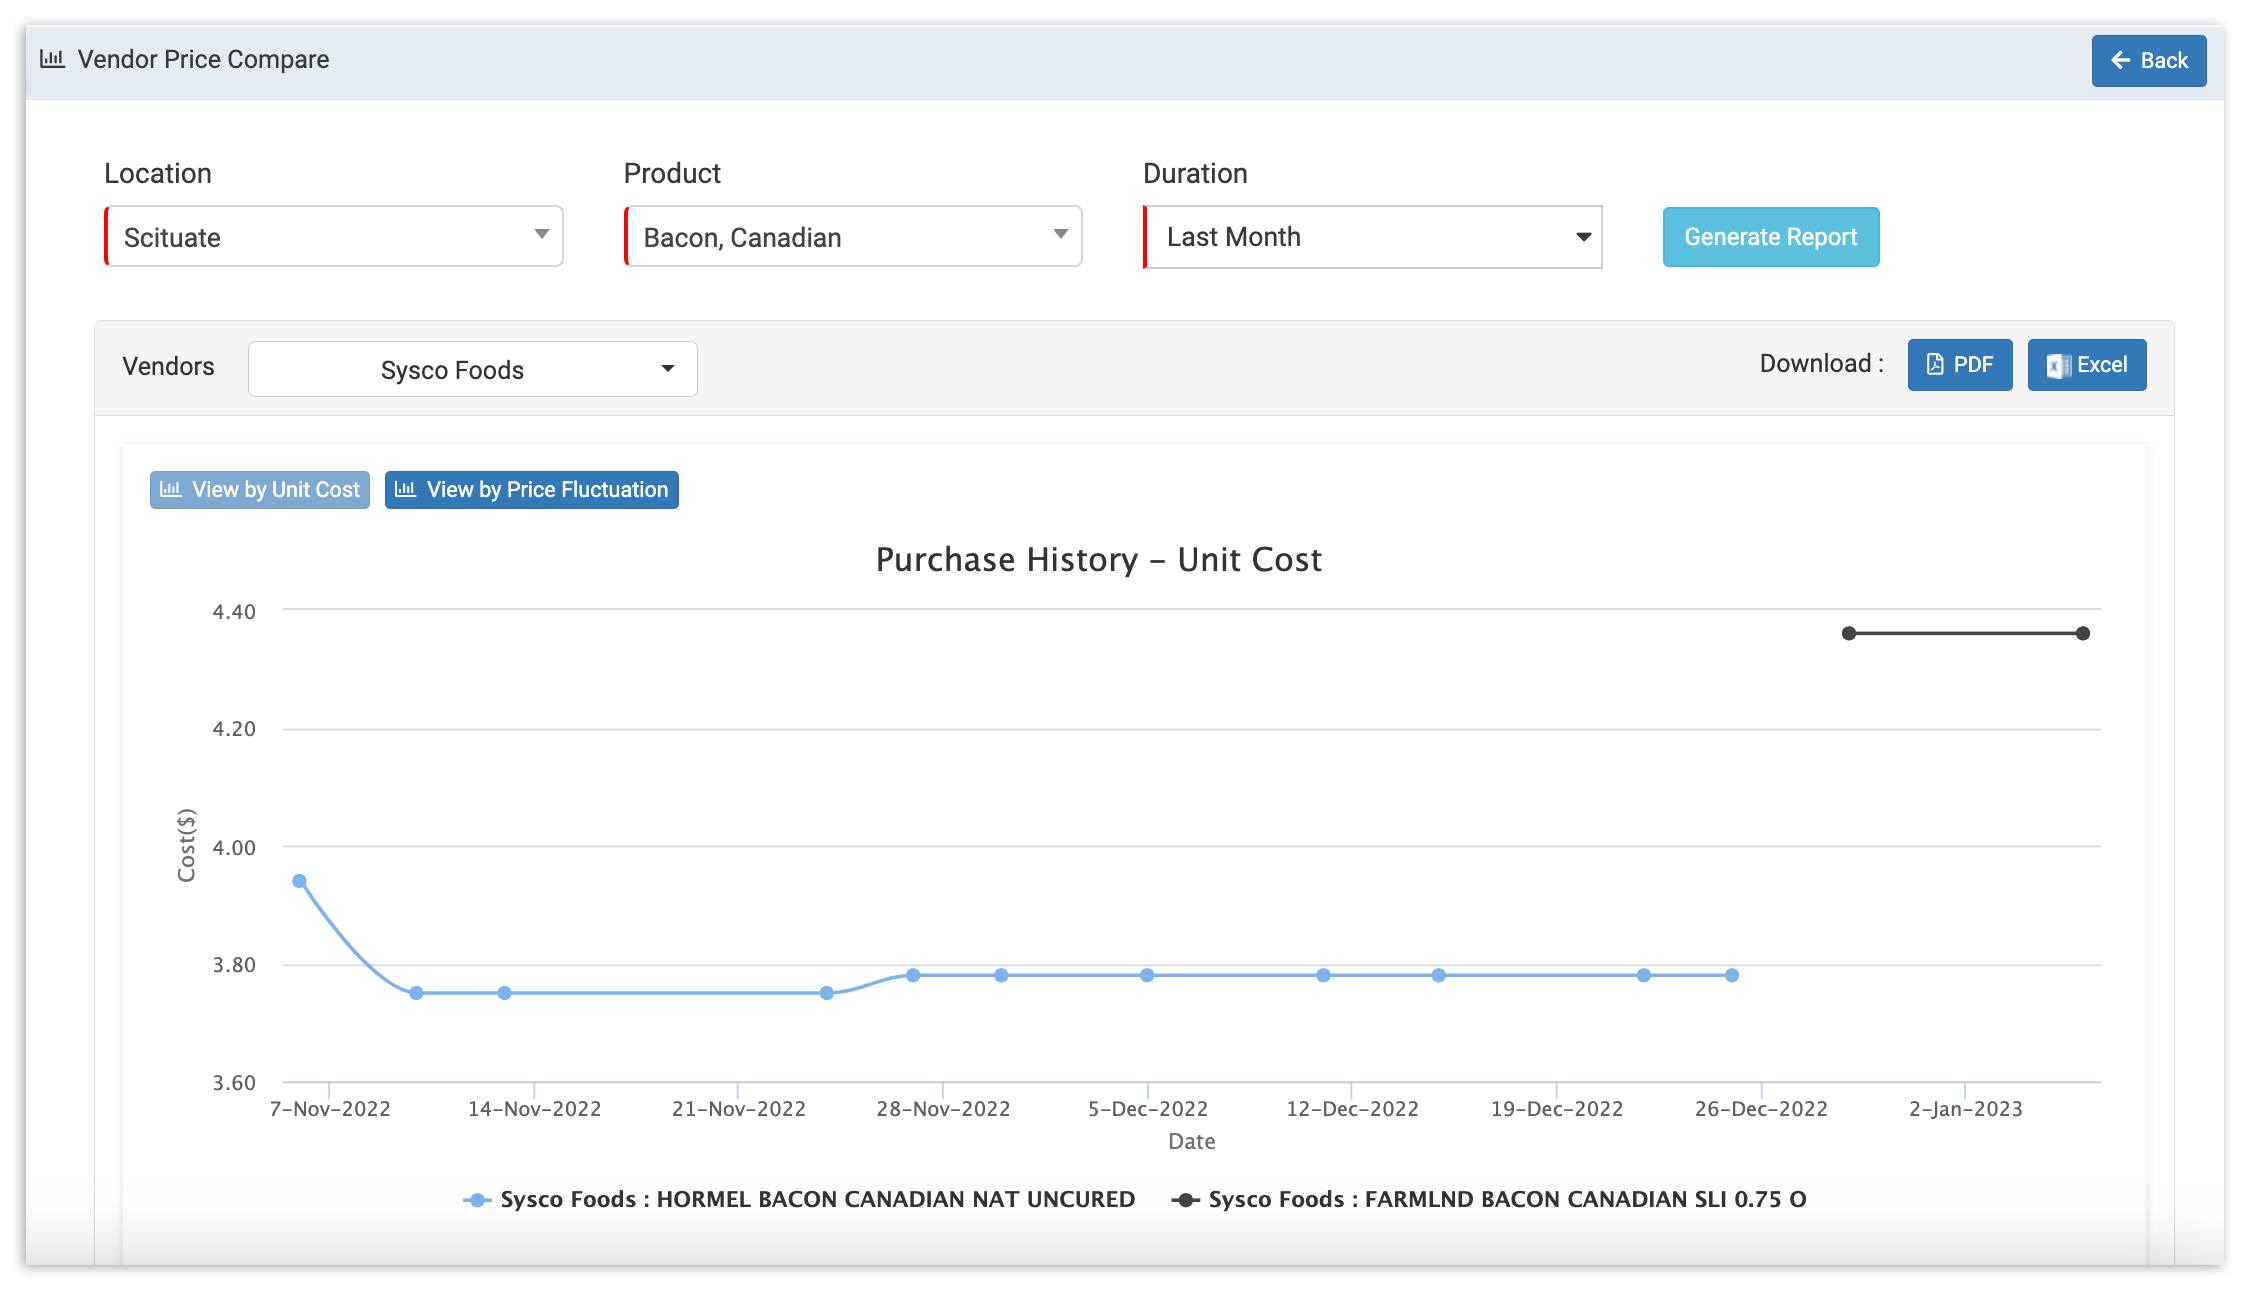
Como su nombre indica, el informe de comparación de precios de proveedores contrasta cuánto gastas en un determinado artículo de factura por proveedor. Para comenzar, elige tu ubicación, producto y duraciónantes de seleccionar Generar informe.
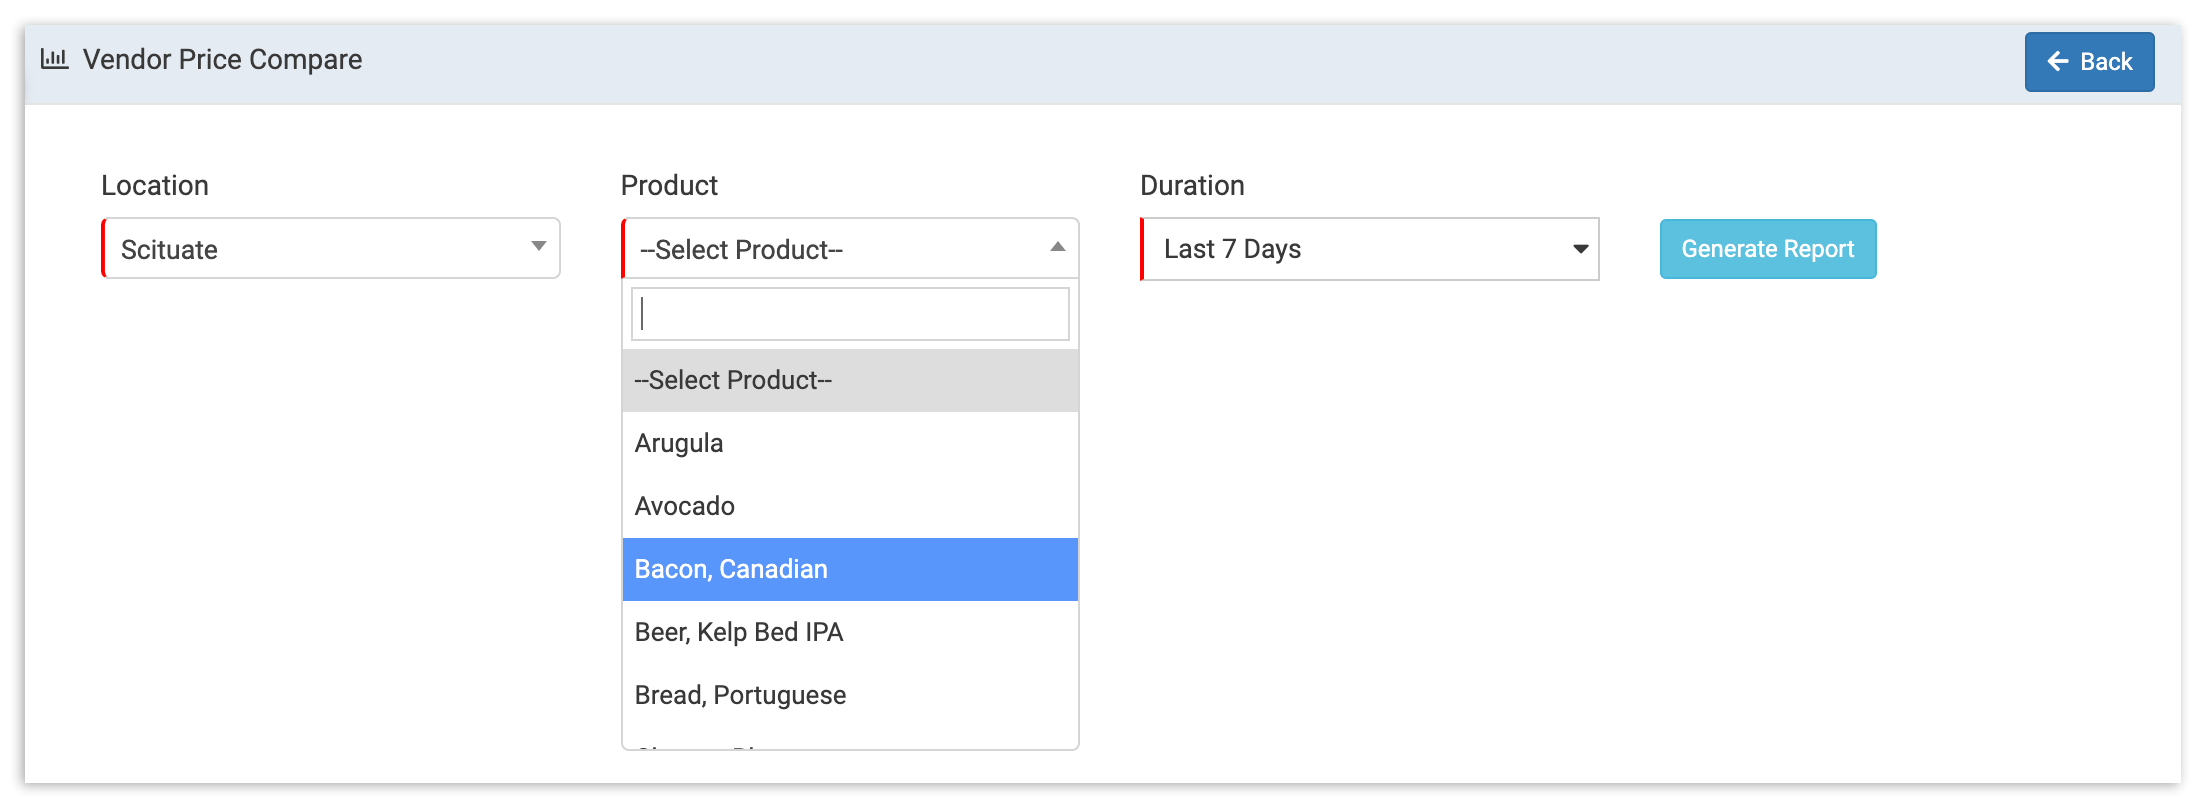
Una vez completado, notarás que hay dos tipos de informes de comparación de precios disponibles: Ver por costo unitario y Ver por fluctuación de precios. Tu informe Ver por costo unitario muestra cuánto cobra cada uno de tus proveedores por el mismo artículo. Esto puede ayudarte a tomar decisiones rápidas cuando se trata de ahorrar en artículos similares de proveedores.
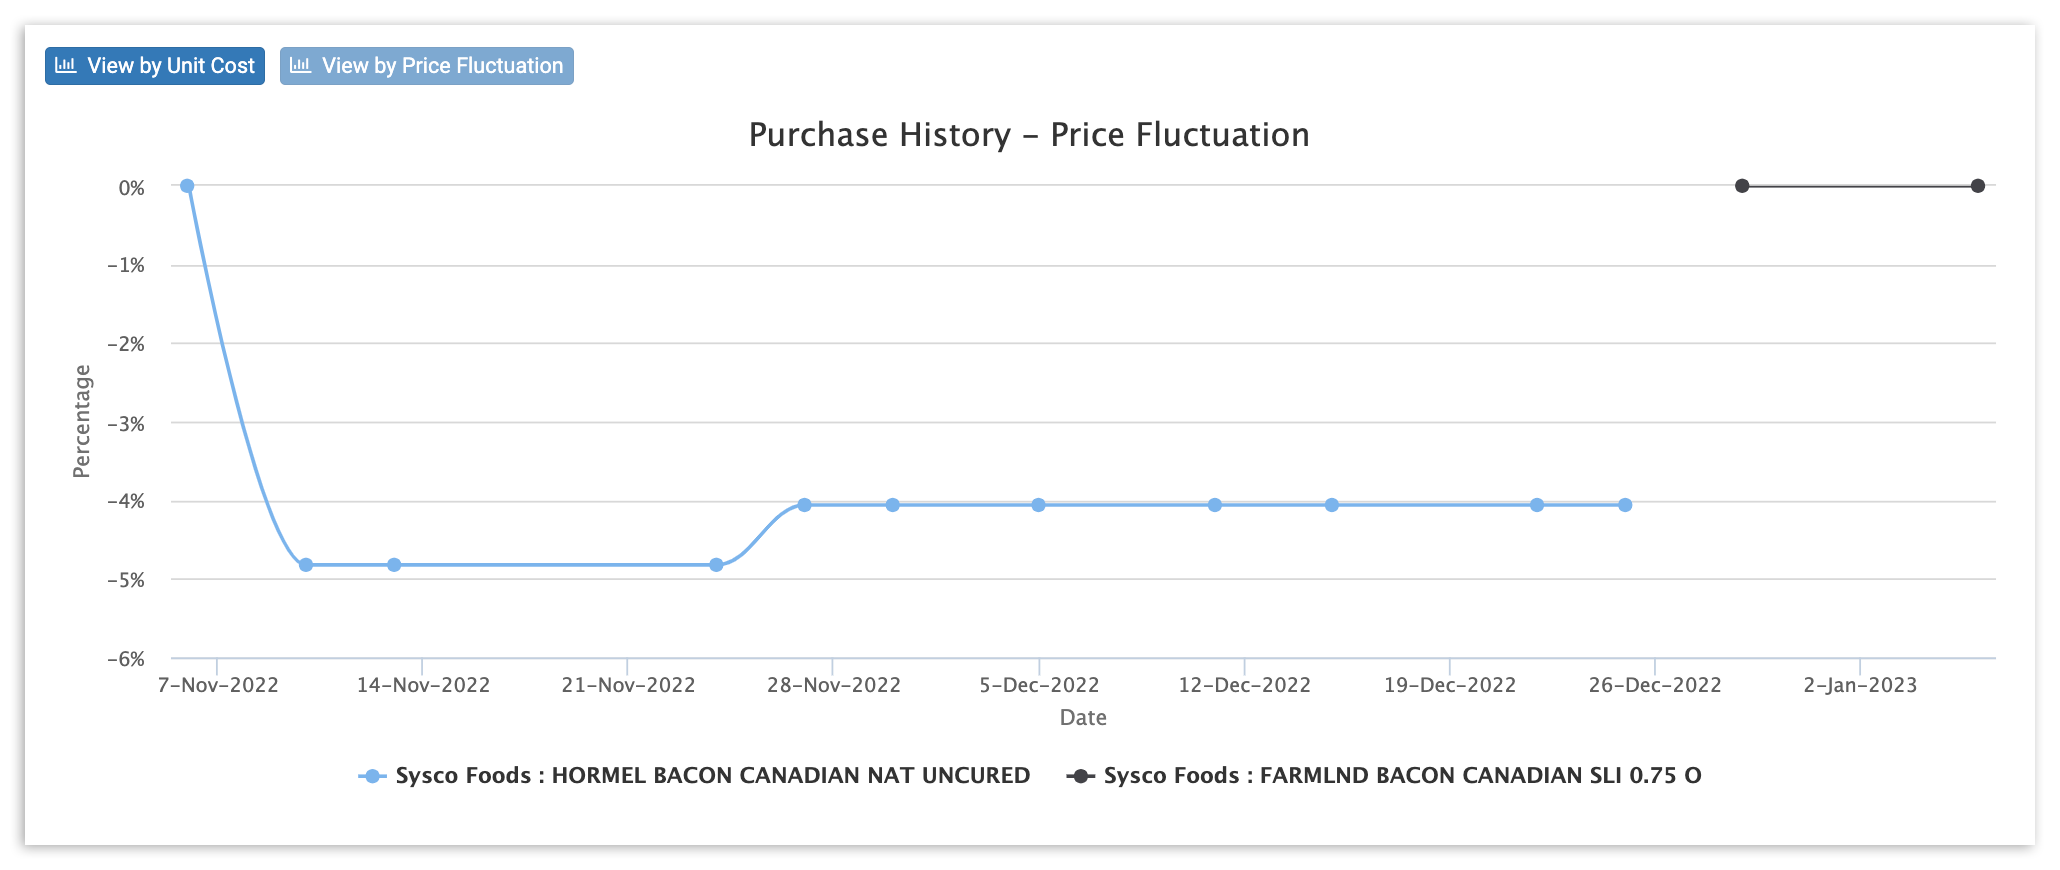
Para asegurarte de que obtengas el precio más competitivo de tus proveedores, consulta el informe Ver por fluctuación de precios. Esto te da una idea clara de cuáles de tus proveedores mantienen estables sus precios y cuáles se ven más afectados por factores como problemas de la cadena de suministro, escasez y más. Esto puede ayudarte a tomar decisiones a largo plazo, como trabajar con proveedores que pueden operar con un precio básico más alto, pero cuyos precios no están sujetos a cambios.
Recursos adicionales
- xtraCHEF: Revisar informes en el módulo de informes
- xtraCHEF: Primeros pasos con los informes de visualización de costos
- xtraCHEF: Revisar informes de análisis