xtraCHEF: Revisar informes de análisis
Última actualización: 7 jul 2026, 3:35 p.m.
Resumen de análisis
En xtraCHEF, tu pestaña Análisis desglosa automáticamente los datos relacionados con las compras y las ventas en informes de un vistazo rápido. Al revisar con frecuencia tus estadísticas, puedes aumentar la visibilidad del estado general de tu restaurante y controlar el gasto antes de que las tendencias se conviertan en un peligro para tu rentabilidad general.
Hay varias opciones disponibles en tu cuenta de xtraCHEF. Cada uno de estos proporciona una descripción general de alto nivel del gasto, los costos o ambos desglosados junto con imágenes fáciles de digerir.
Volver al inicio
Tus análisis
Para acceder a estas herramientas, selecciona Analíticas en la barra de navegación. Aquí, puedes seguir navegando a una serie de informes diferentes, a saber, Gasto por libro mayor (GL), Categoría semanal, Costo de los alimentos semanal, Gasto por categoría, Gasto por proveedor, Volumen y Comparación de unidades.
A continuación, se desglosa una descripción de estos análisis y sus casos de uso.
Gasto por LM
¿Quieres ver qué es lo que está comiendo la mayor parte de tu presupuesto entre un rango de fechas establecido? El gasto por libro mayor desglosa todo tu gasto por código de libro mayor, lo que te permite identificar rápidamente tendencias inesperadas o simplemente vigilar cómo se asignan generalmente los fondos a las compras.
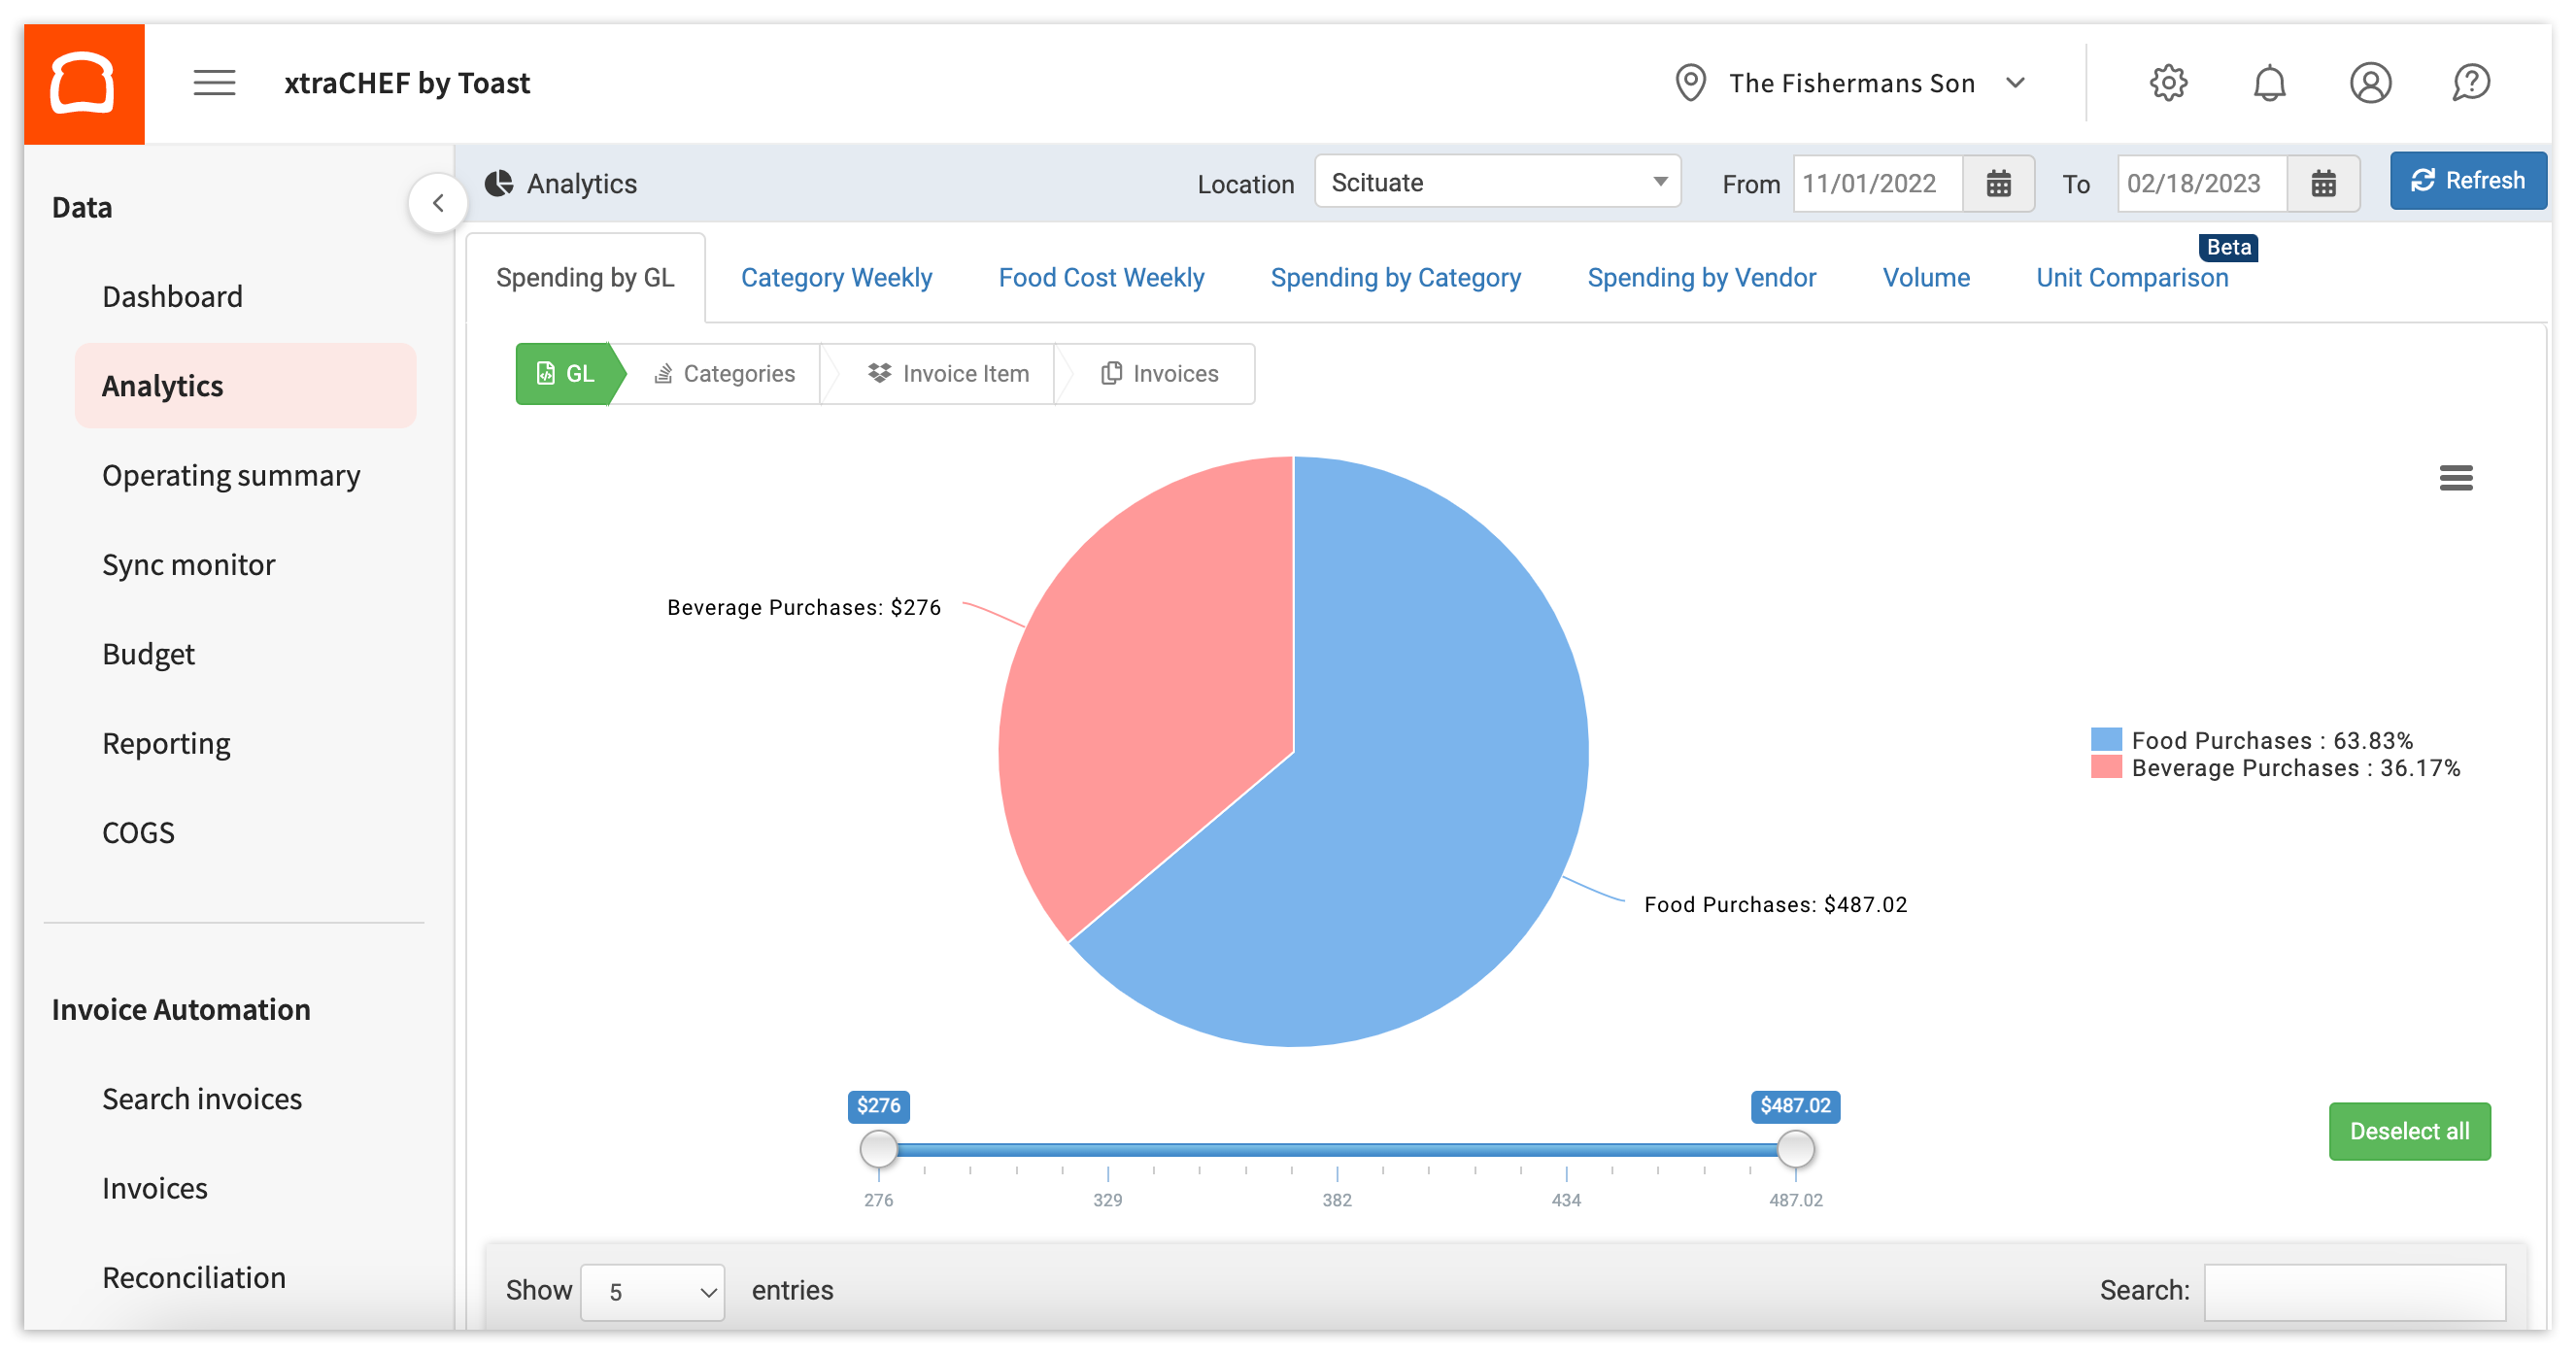
Si utilizas subcategorías dentro de tus códigos de LM, puedes profundizar aún más en tus gastos. Leer xtraCHEF: Primeros pasos con el análisis de gastos de LM para obtener más información.
Categoría semanal
Semanalmente por categoría es similar al Gasto por libro mayor y el Gasto por categoría, ya que desglosa tus gastos. Dicho esto, este informe en particular te permite monitorear y comparar las tendencias de gasto una junto a la otra semana tras semana.
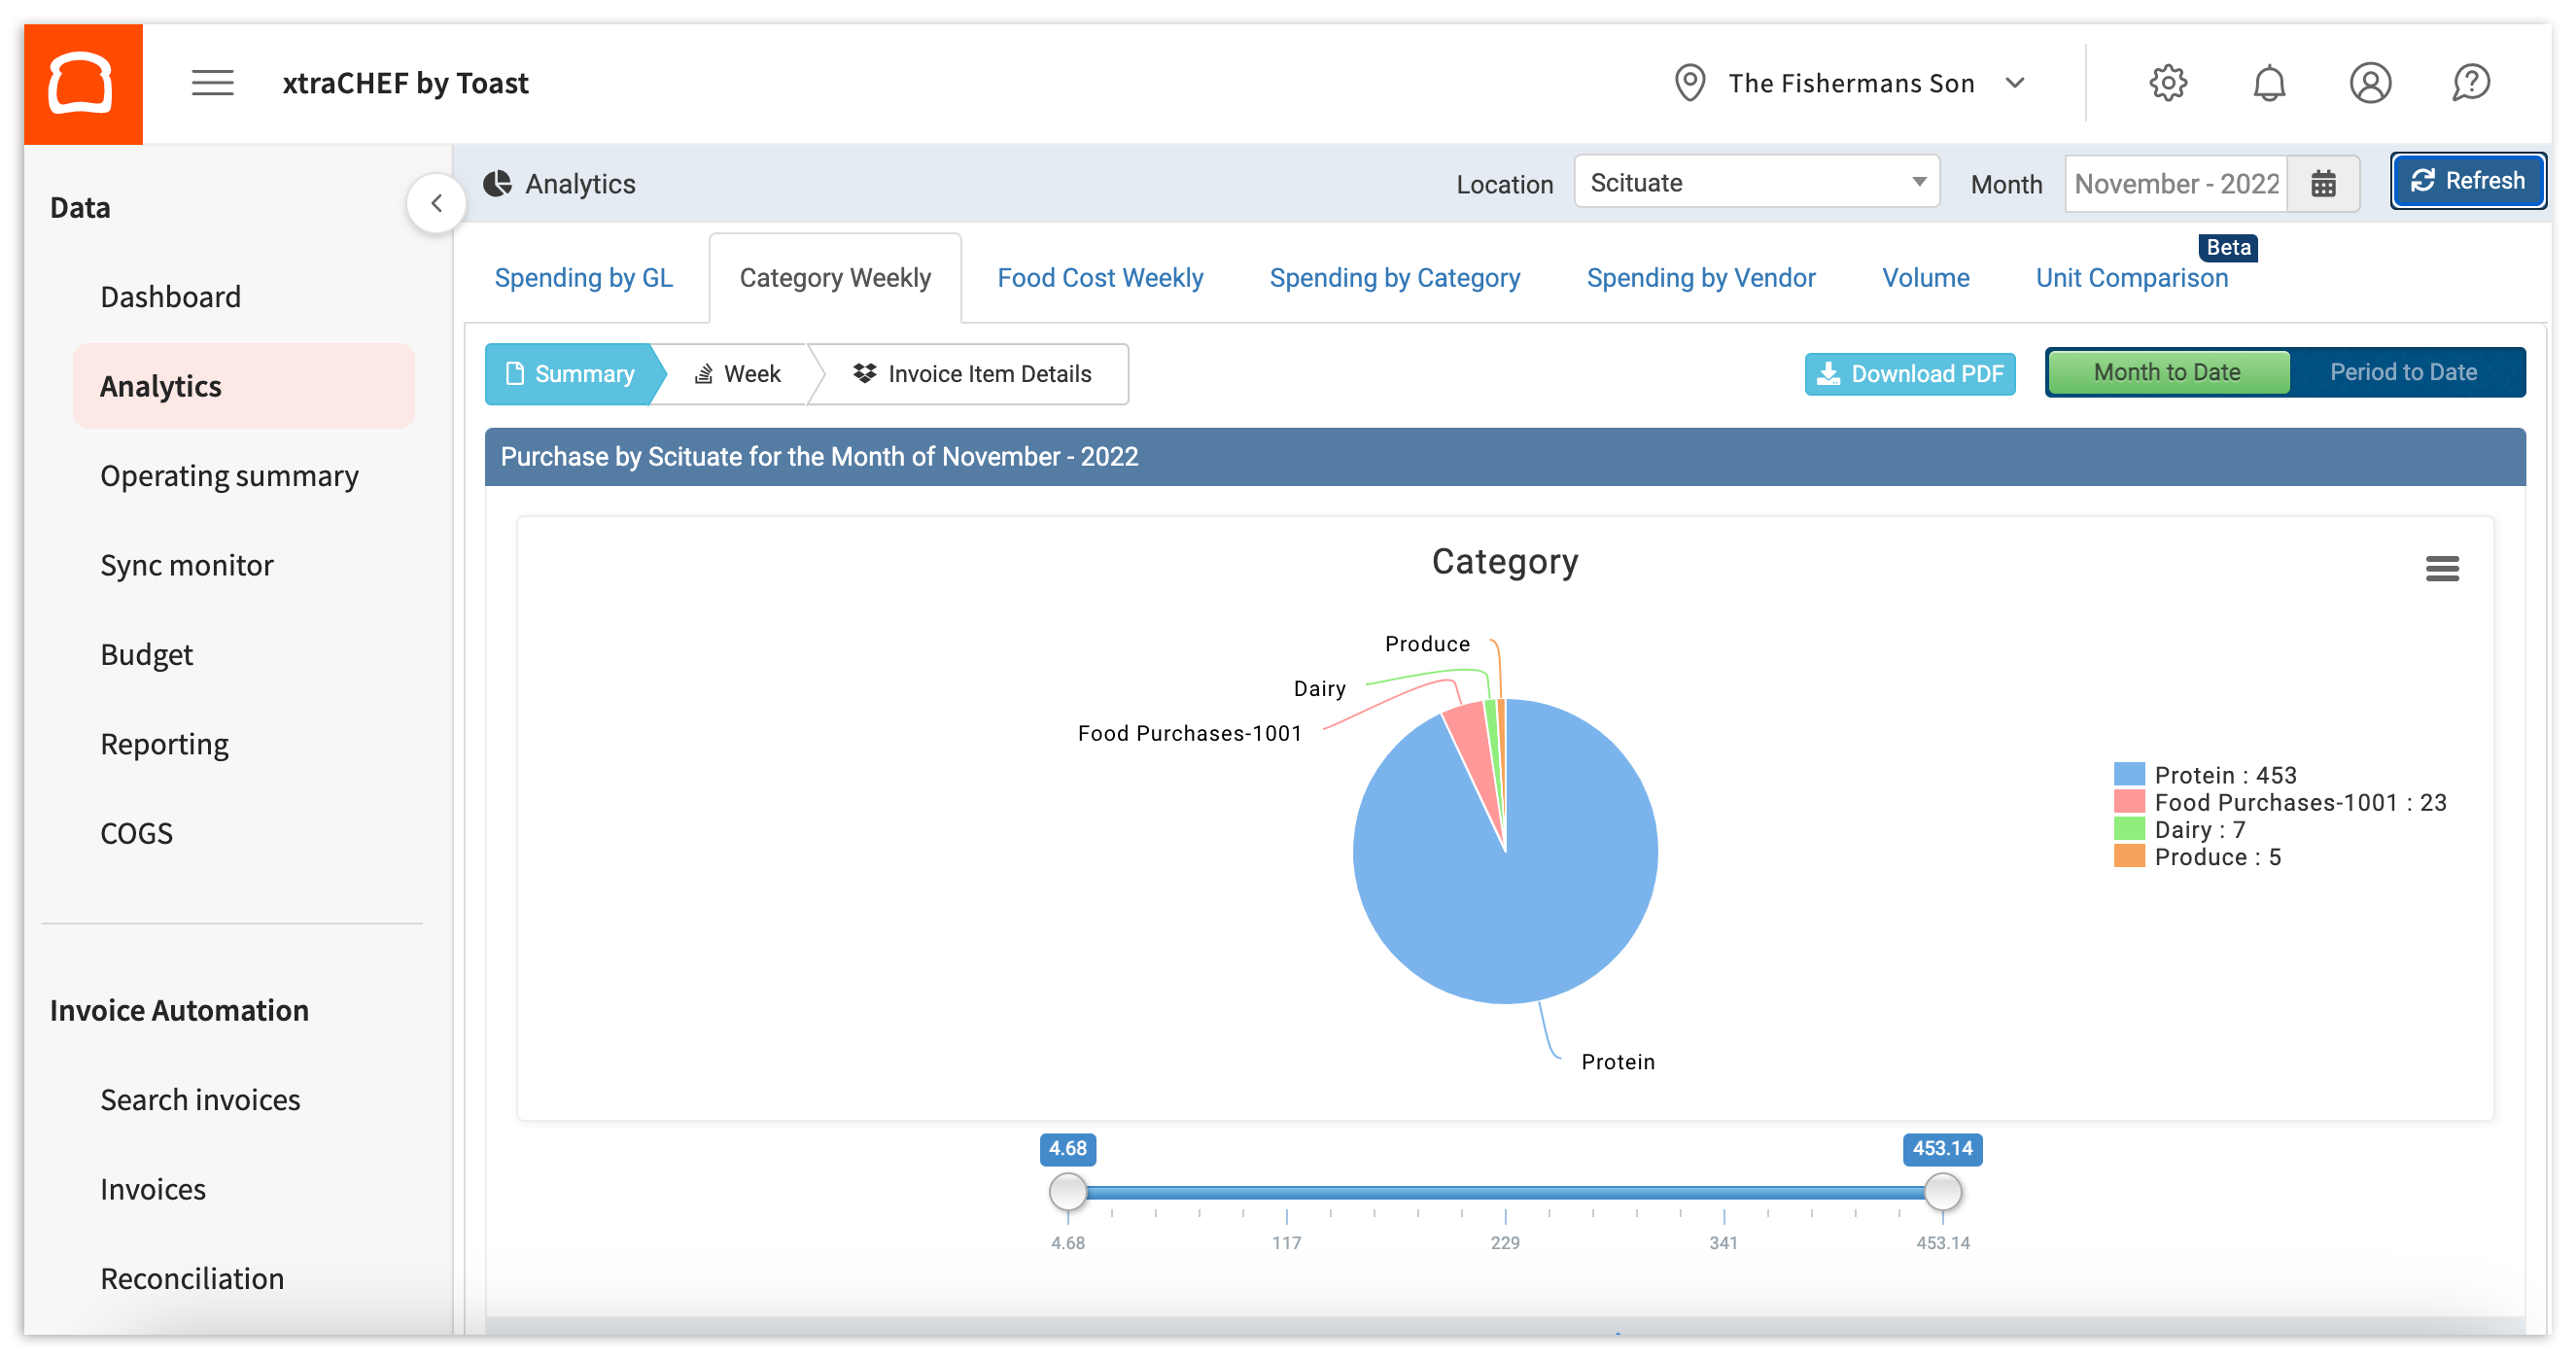
Para obtener más información, consulta xtraCHEF: Primeros pasos con el análisis semanal por categoría.
Costo de alimentos semanal
El costo de los alimentos semanalmente va más allá de las compras. Si completaste la asignación de COGS, un paso importante para la configuración, este informe te permite ver rápidamente un desglose de tus gastos y ventas por grupo de costo de los bienes vendidos (COGS) y profundizar en la relación entre ambos.
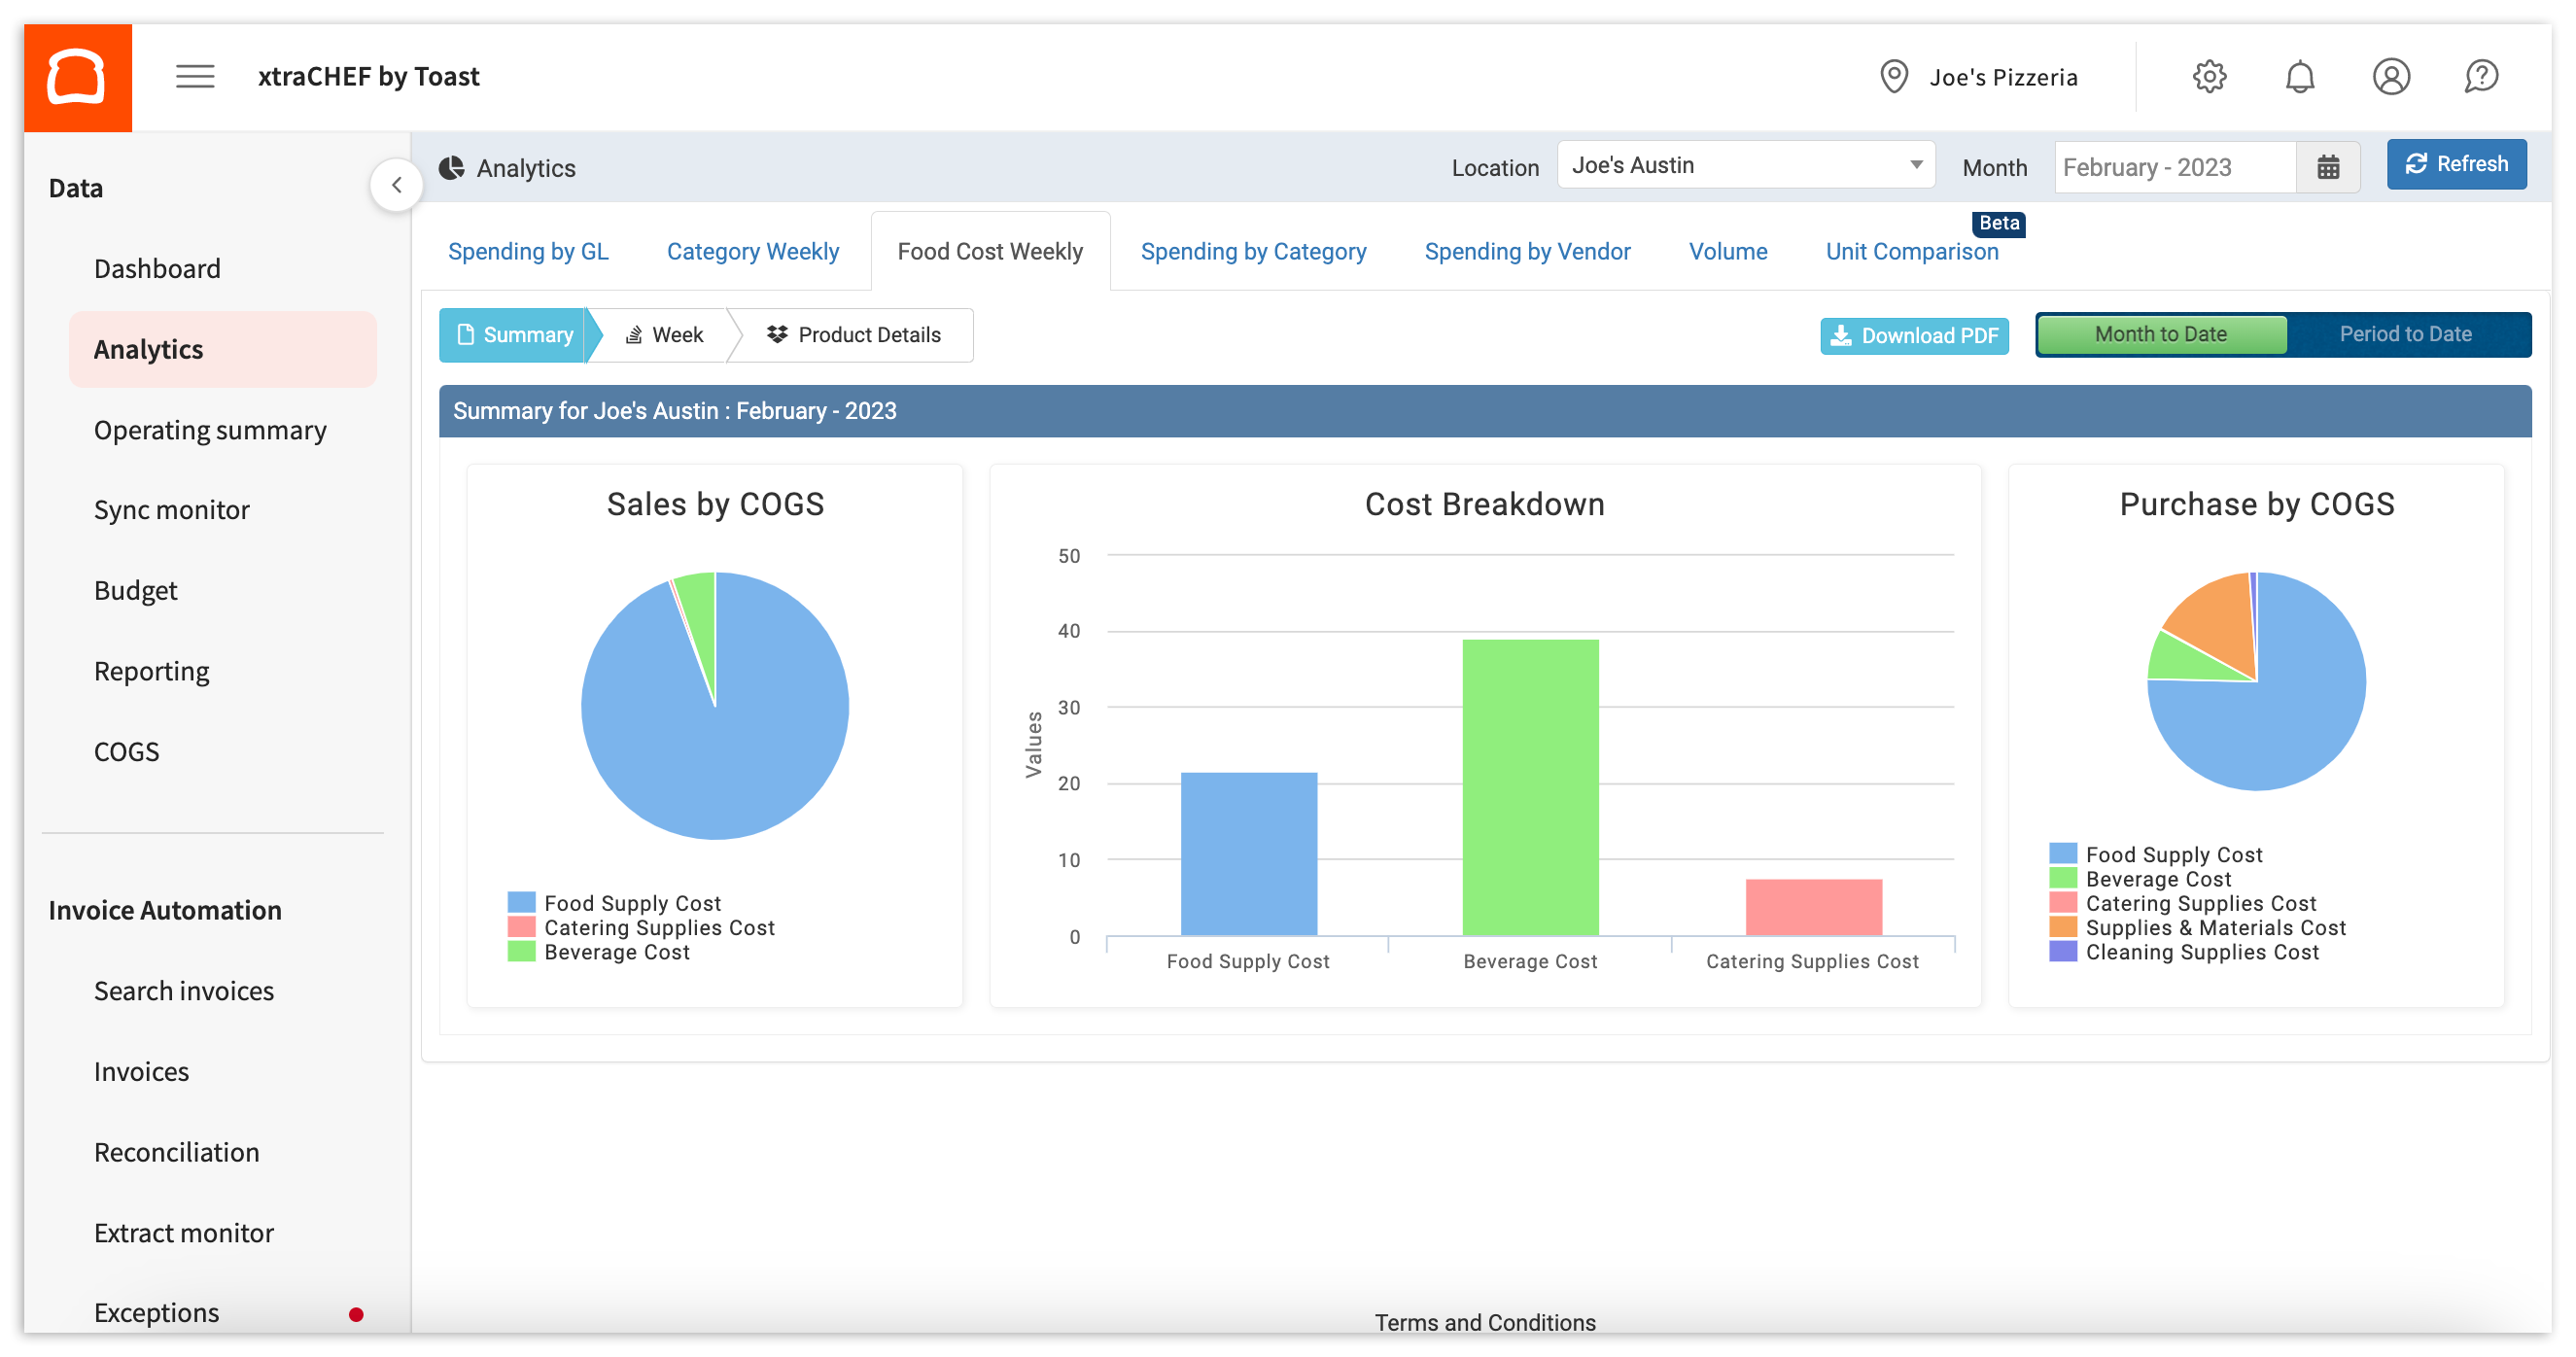
Para obtener más información sobre este informe, visita xtraCHEF: Primeros pasos con el análisis semanal del costo de los alimentos.
Gasto por categoría
De manera similar al gasto por libro mayor, este informe desglosa tus gastos por categoría.
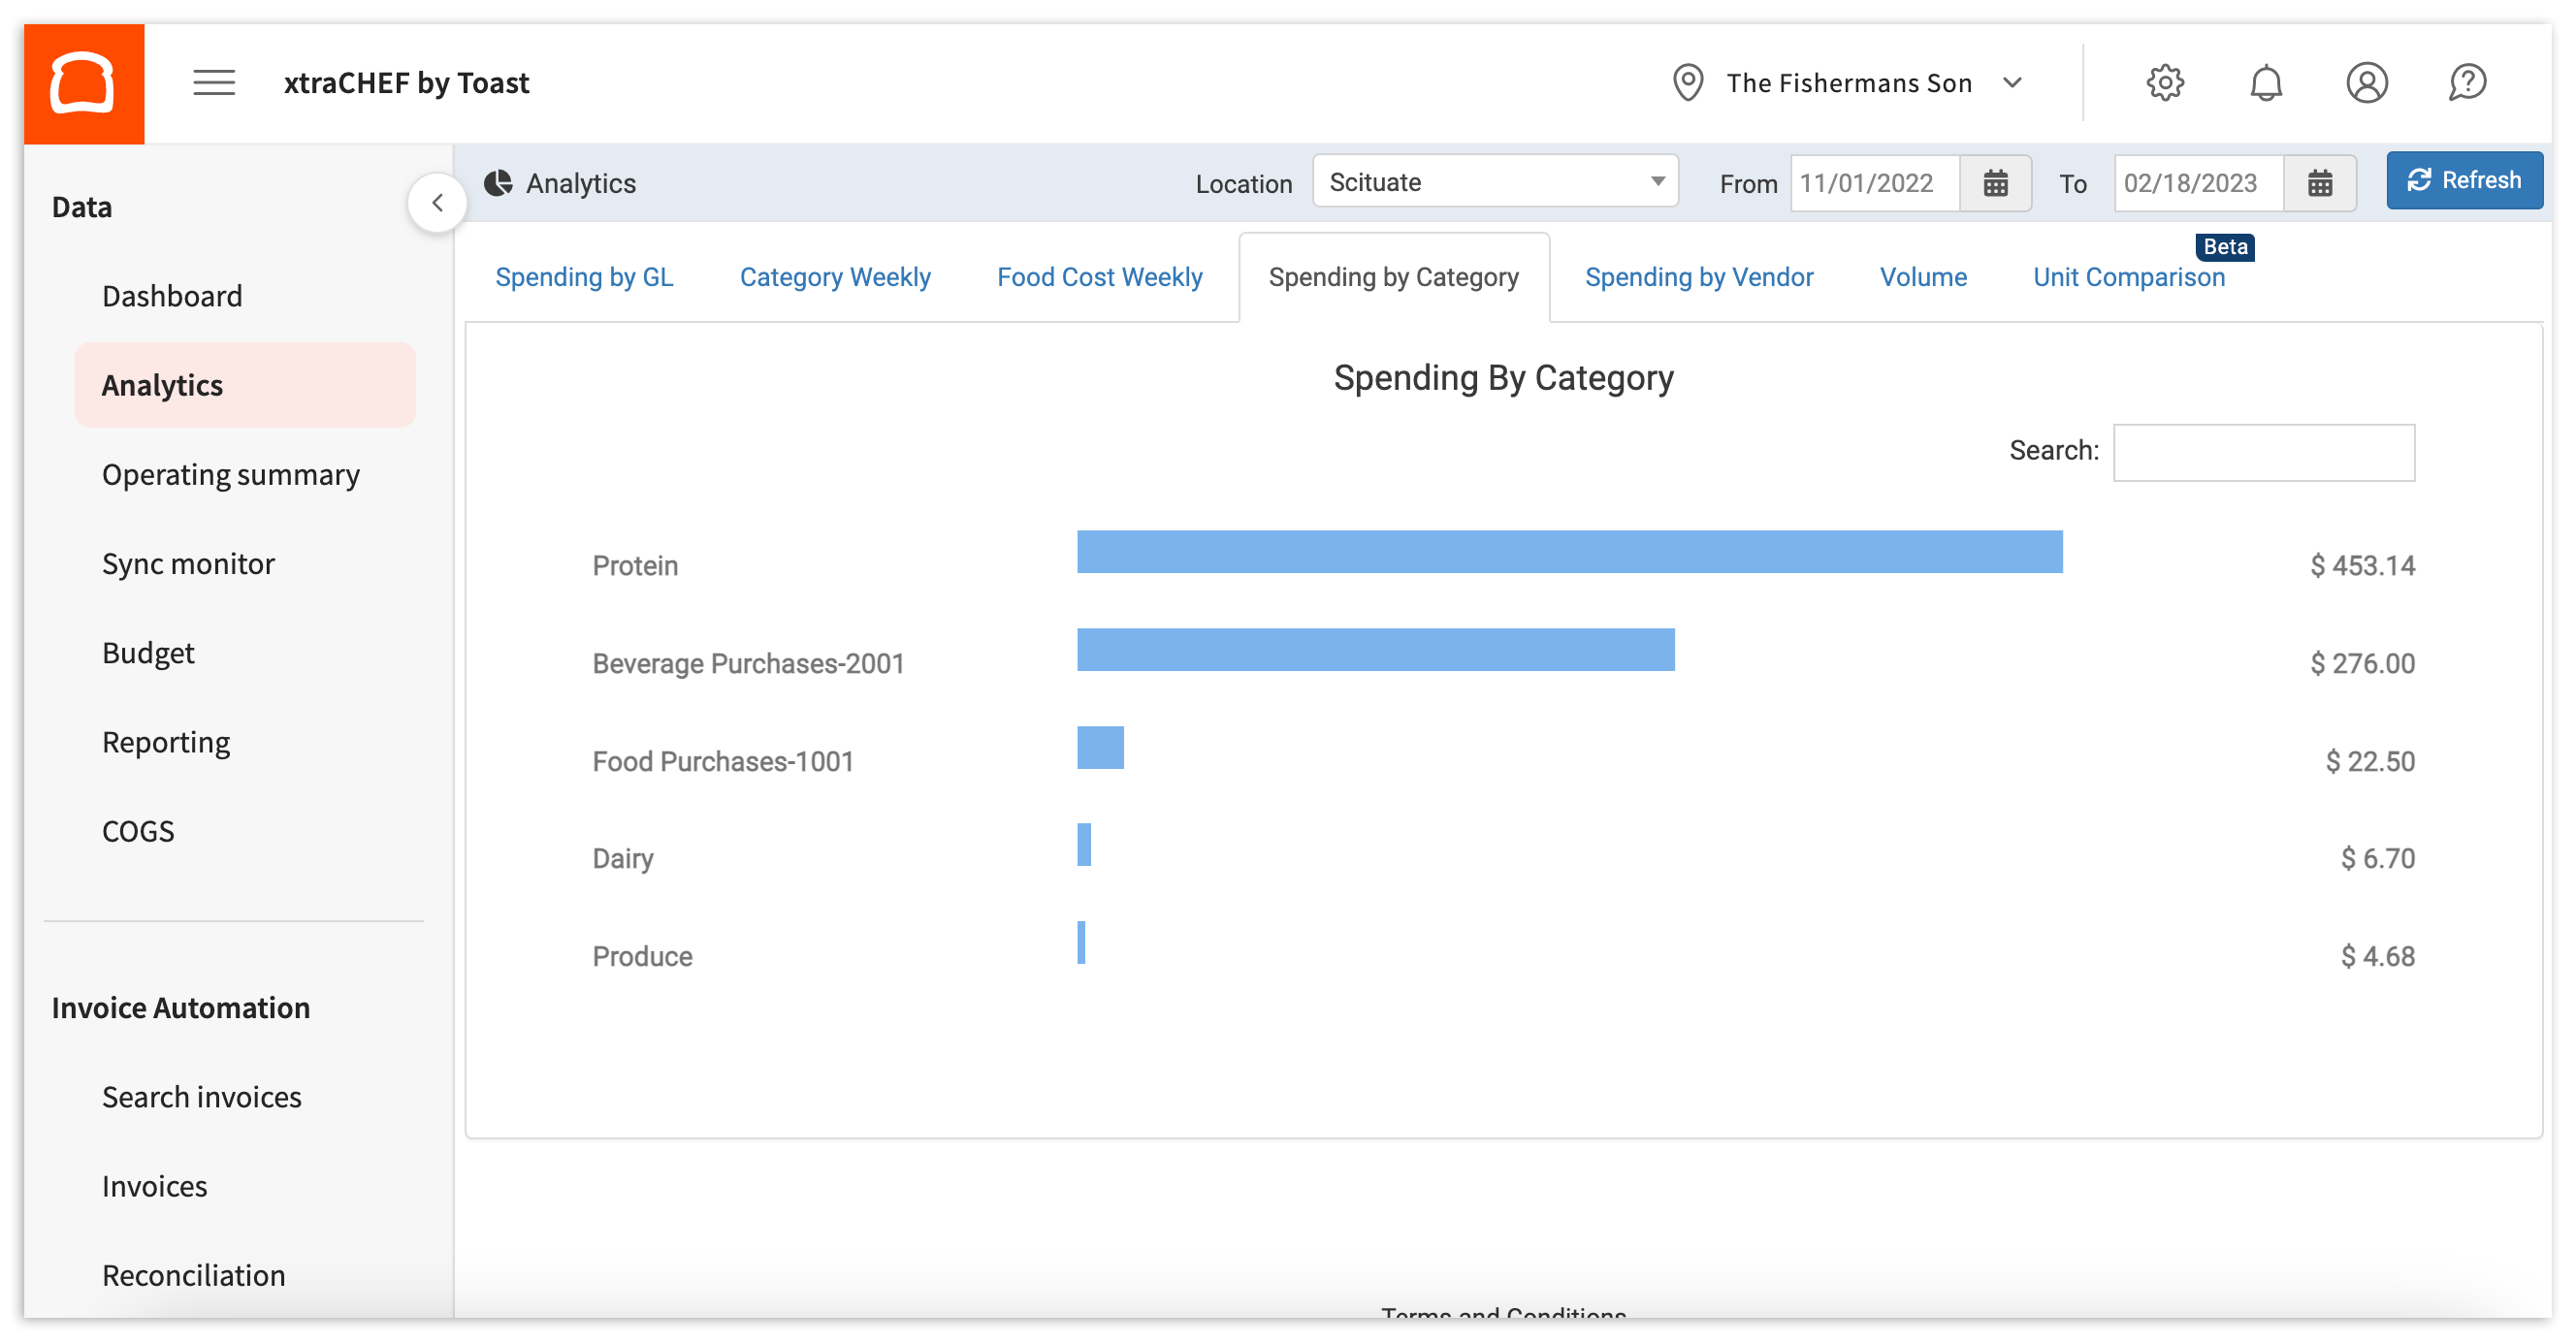
xtraCHEF: Primeros pasos con el gasto por categoría Analytics ofrece más información sobre este informe.
Gasto por proveedor
Este informe desglosa tus gastos por proveedor entre un rango de fechas establecido. Aquí, puedes supervisar o explorar con qué proveedores gastas más, así como los códigos de libro mayor, las categorías y los artículos de facturas que consumen la mayoría de esos gastos.
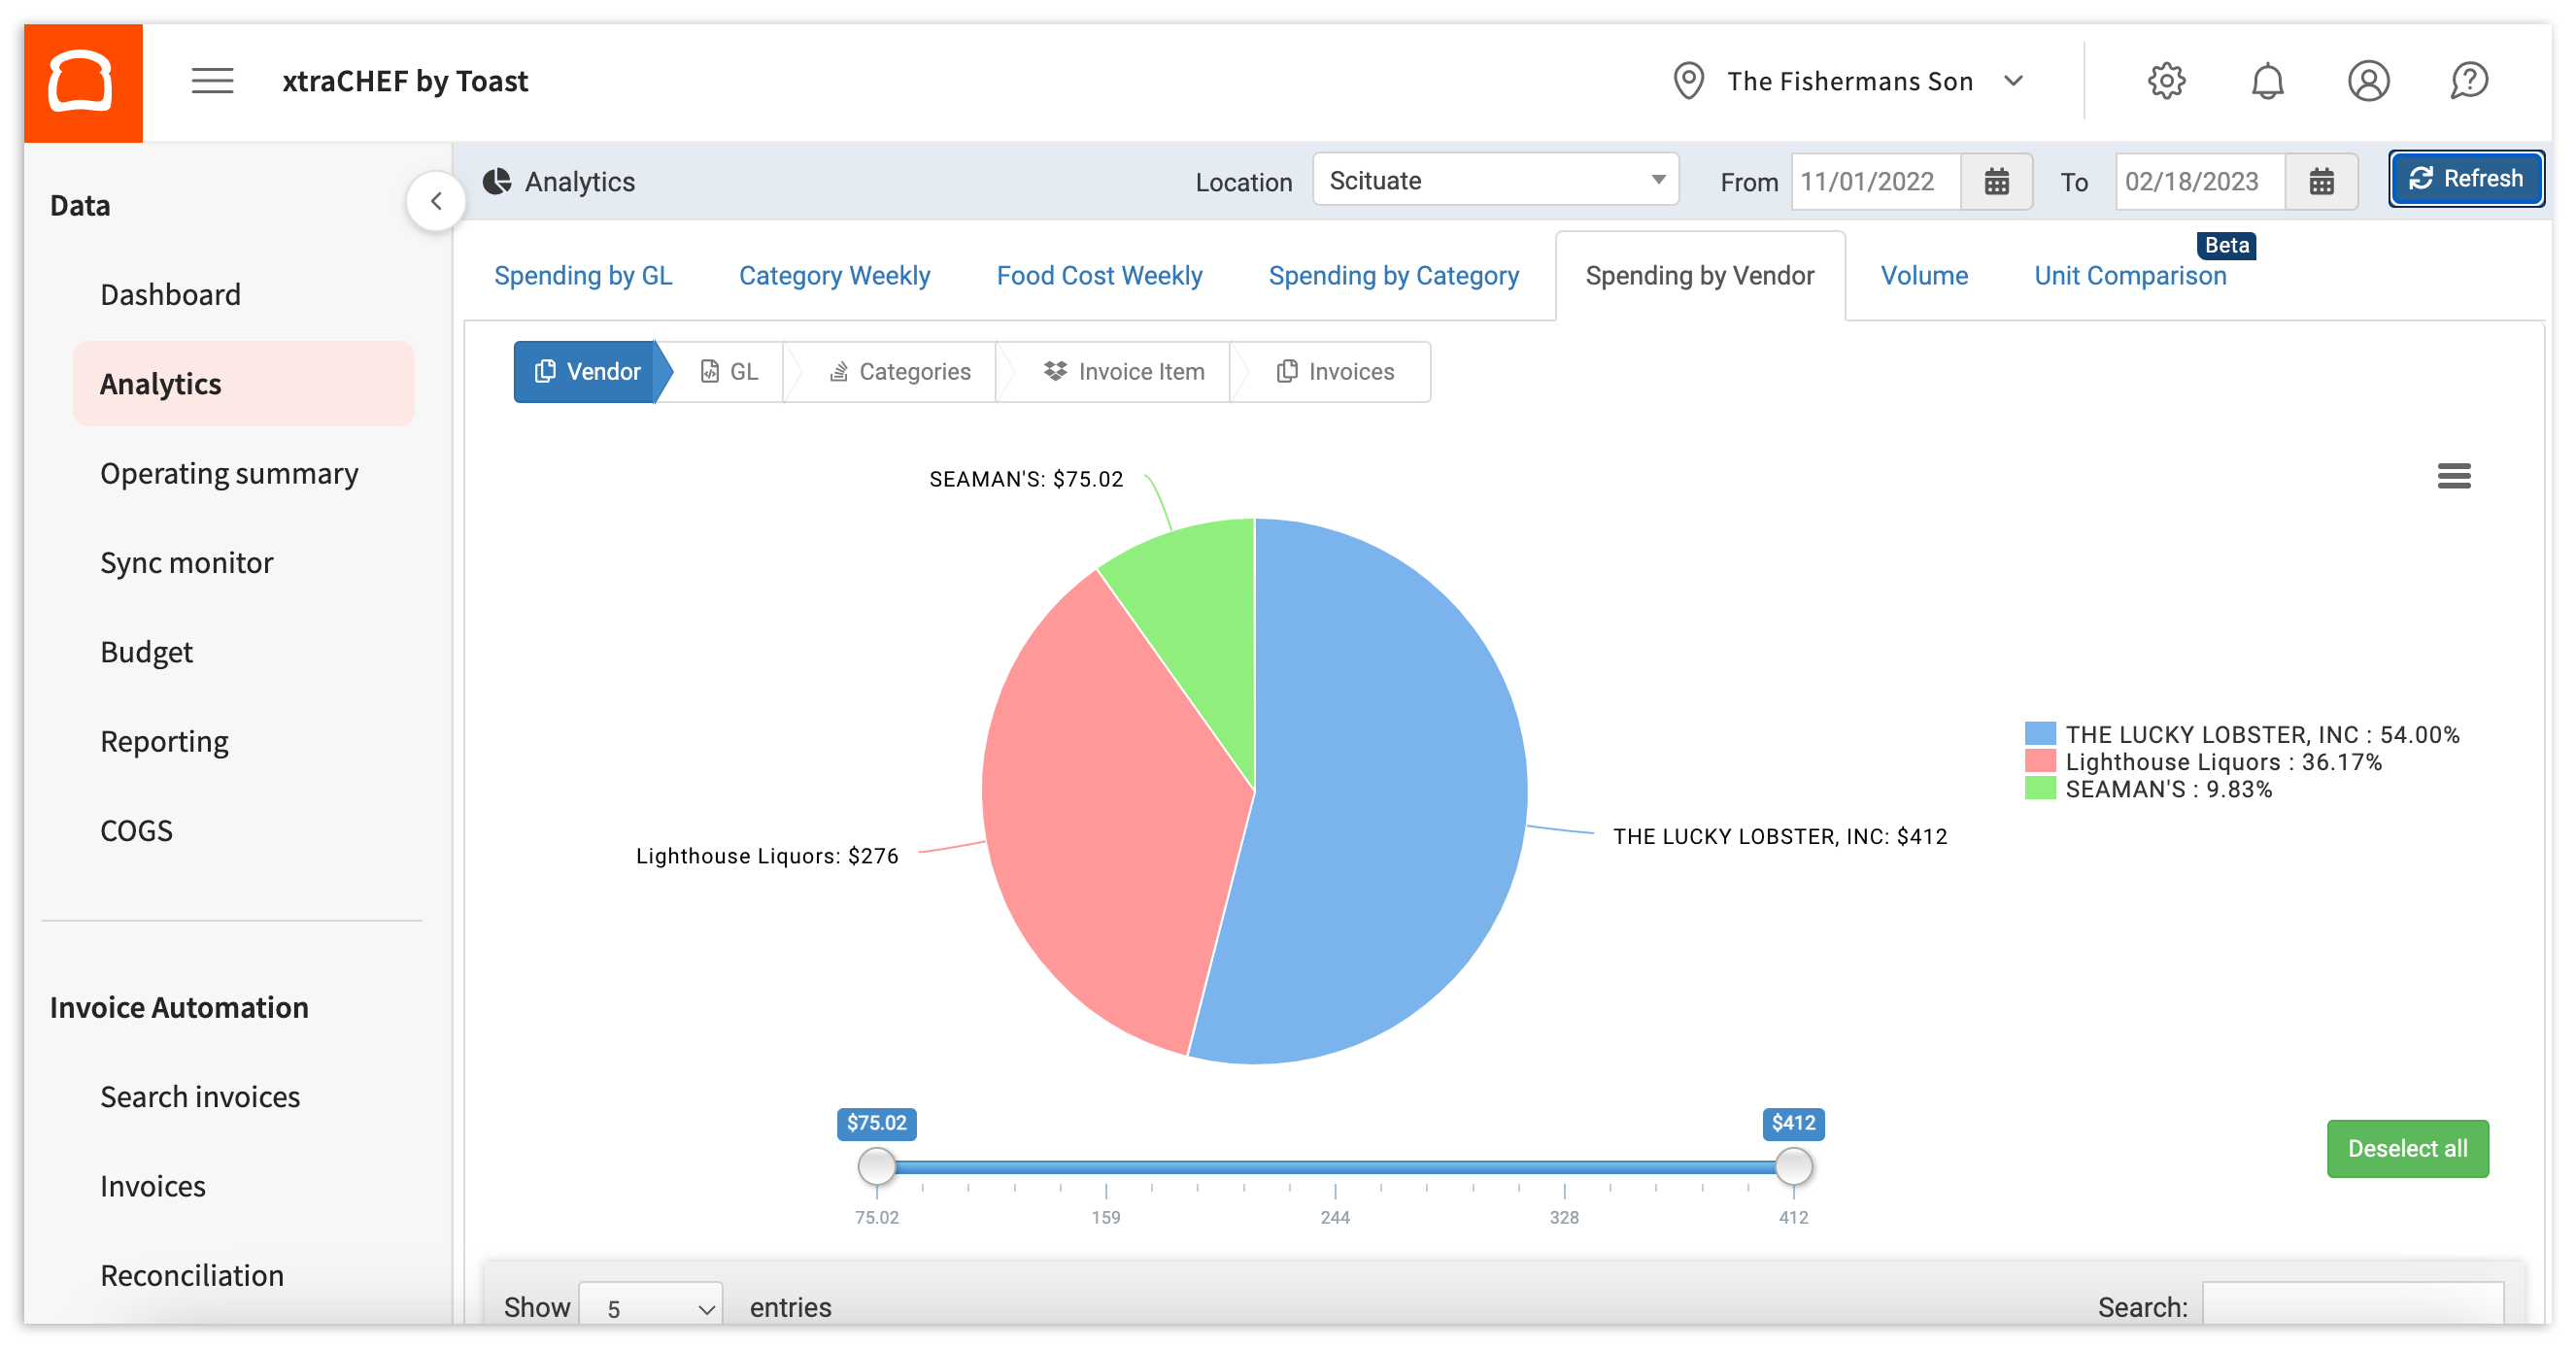
Puedes obtener más información consultando xtraCHEF: Primeros pasos con el análisis de gastos del proveedor.
Comparación de unidades
Este conjunto de estadísticas es particularmente beneficioso si tienes más de una ubicación en tu cuenta de xtraCHEF. La comparación de unidades te permite comparar tus gastos por ubicación y ver cómo se comparan tus restaurantes individuales.
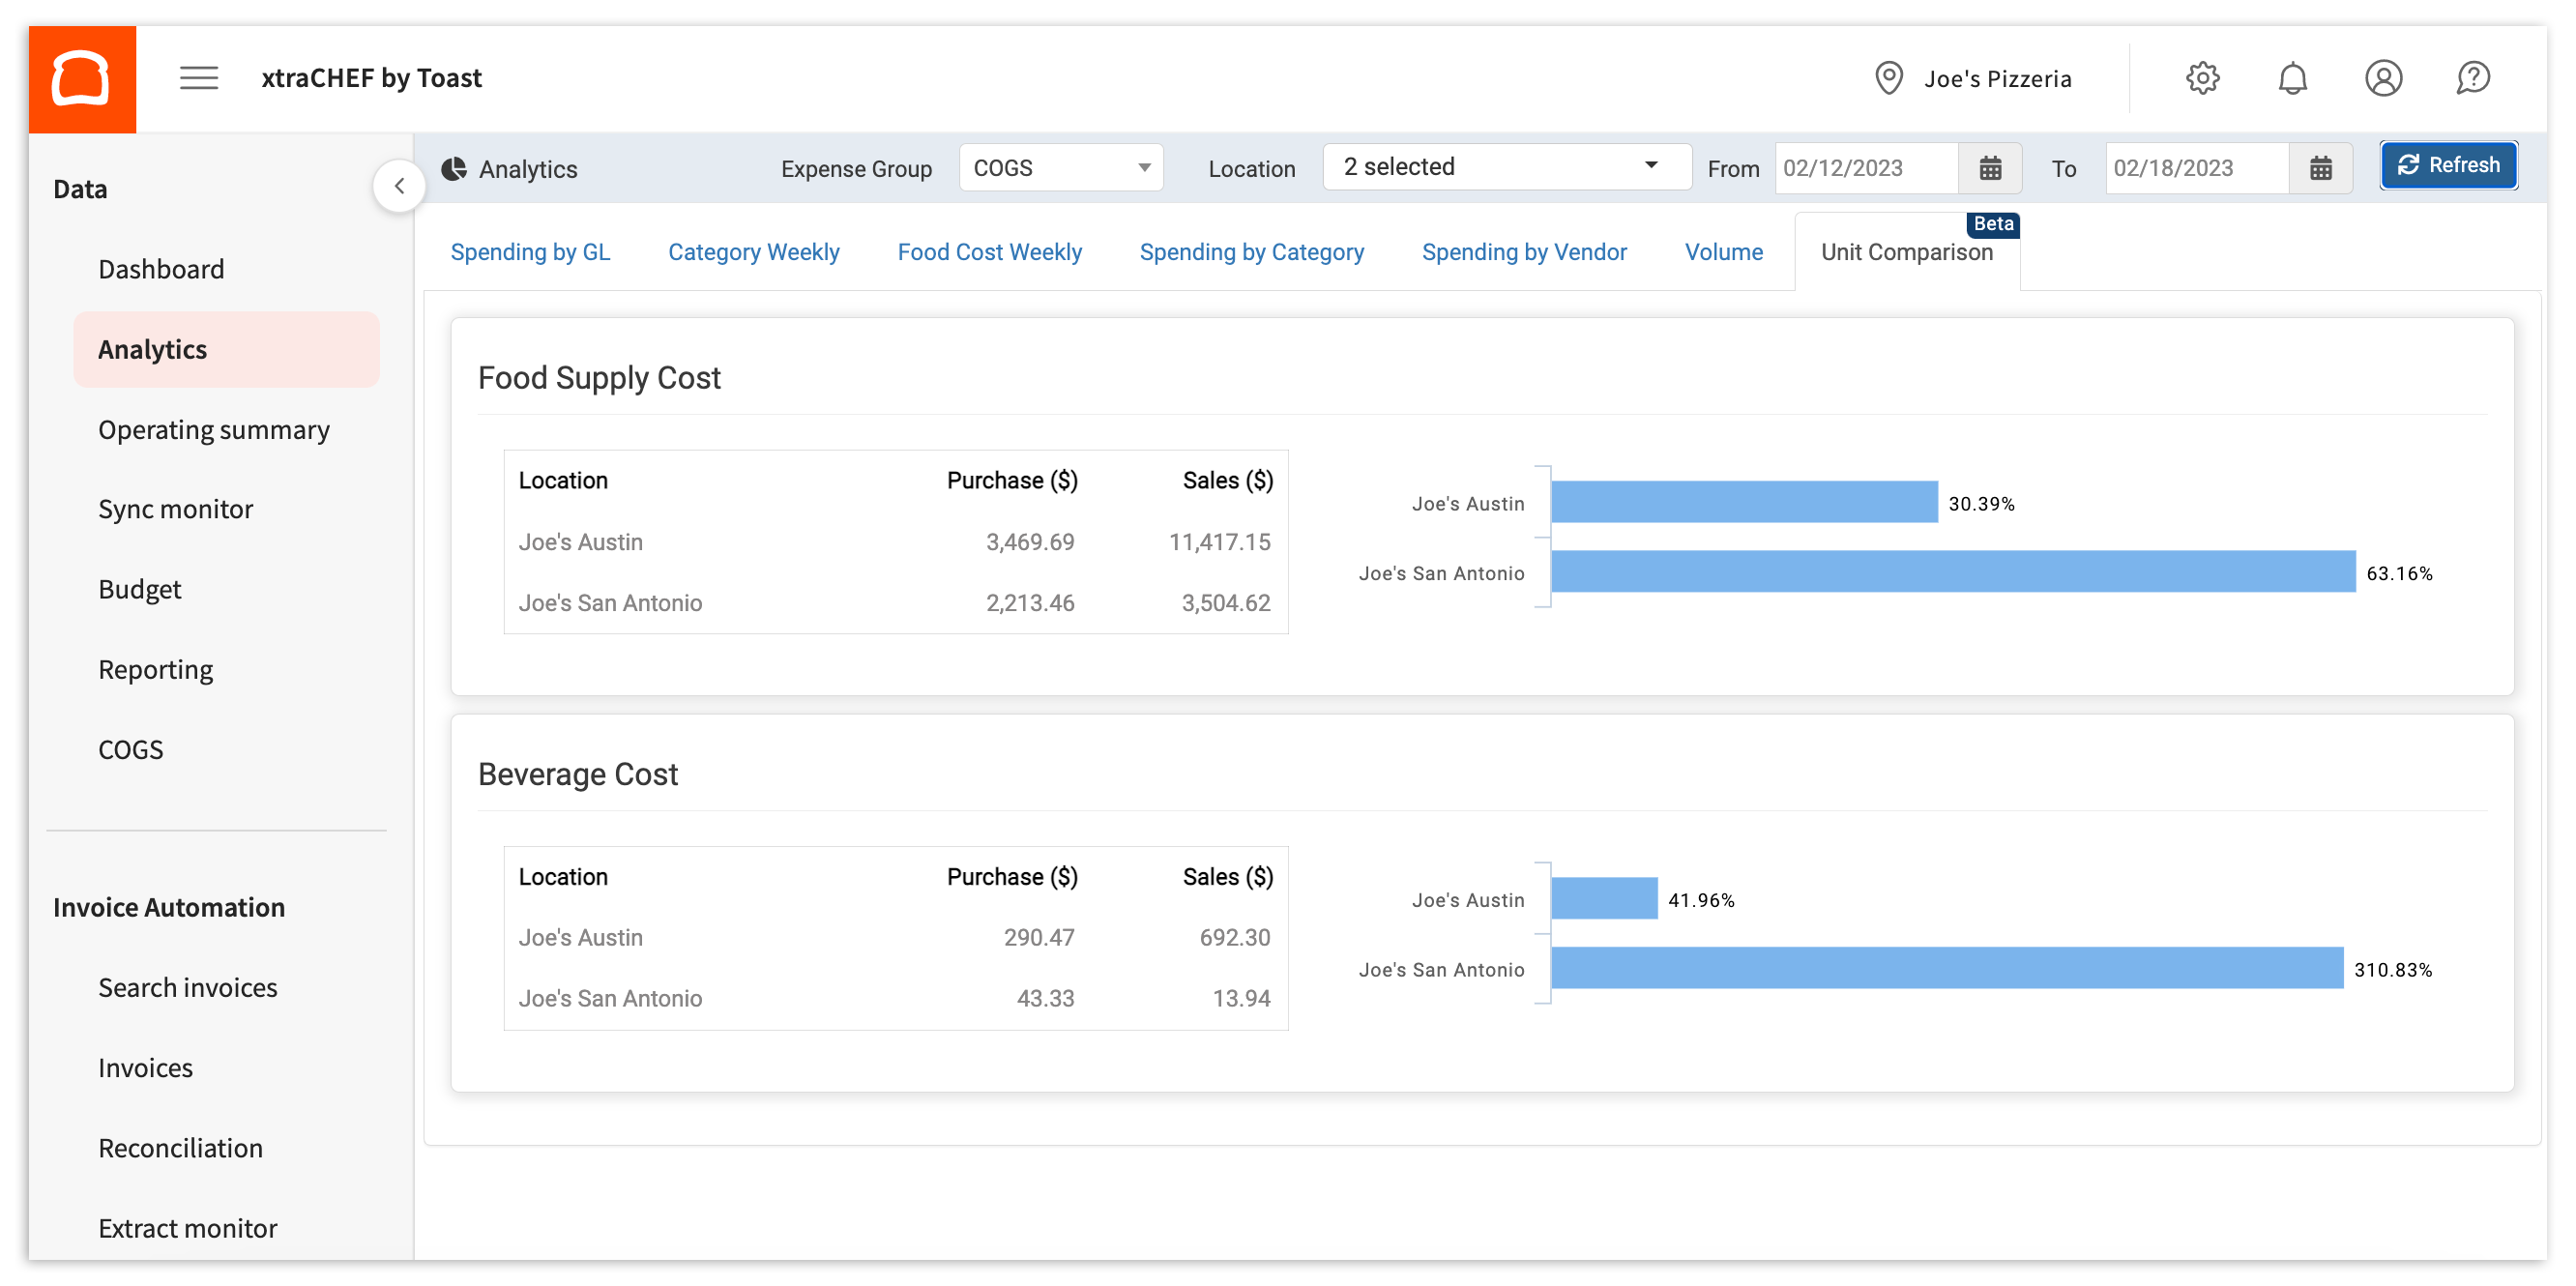
Para obtener más información, consulta xtraCHEF: Primeros pasos con el análisis de comparación de unidades.
Volver al inicio
Recursos adicionales
- xtraCHEF: Revisar informes en el módulo de informes
- xtraCHEF: Primeros pasos con los informes de gestión de costos
- xtraCHEF: Primeros pasos con los informes de visualización de costos