xtraCHEF: Comience con los informes de visualización de costos
Última actualización: 28 abr 2026, 4:20 p.m.
Estos cuatro informes giran en torno a sus gastos y ofrecen diferentes formas de comparar y rastrear en comparación con su gasto total.
- Descripción general de los informes de visualización de costos
- Gastos por categoría
- Gastos por GL
- Gastos por proveedor
- Comparación de unidades
- Recursos adicionales
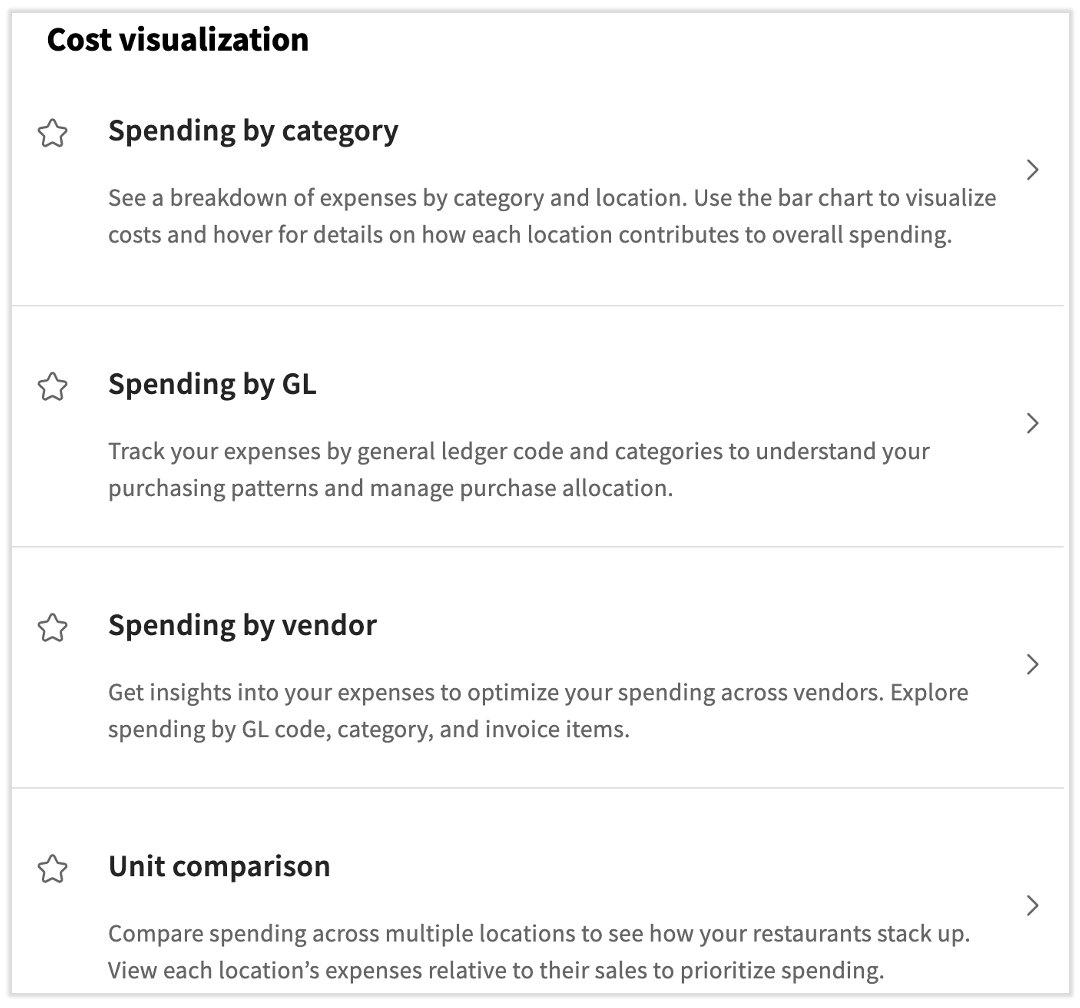
Descripción general de los informes de visualización de costos
Para acceder a la nueva página de informes integral y localizar los informes de visualización de costos, seleccione Informes en el menú de la izquierda y desplácese un poco hacia abajo. Tenga en cuenta que puede seleccionar el icono de estrella y el informe se guardará en el menú de Favoritos en el lado izquierdo de esta página.
Como nota al margen, los informes de distribución de GL y resumen de GL son reemplazados por el informe de resumen de facturas por GL.
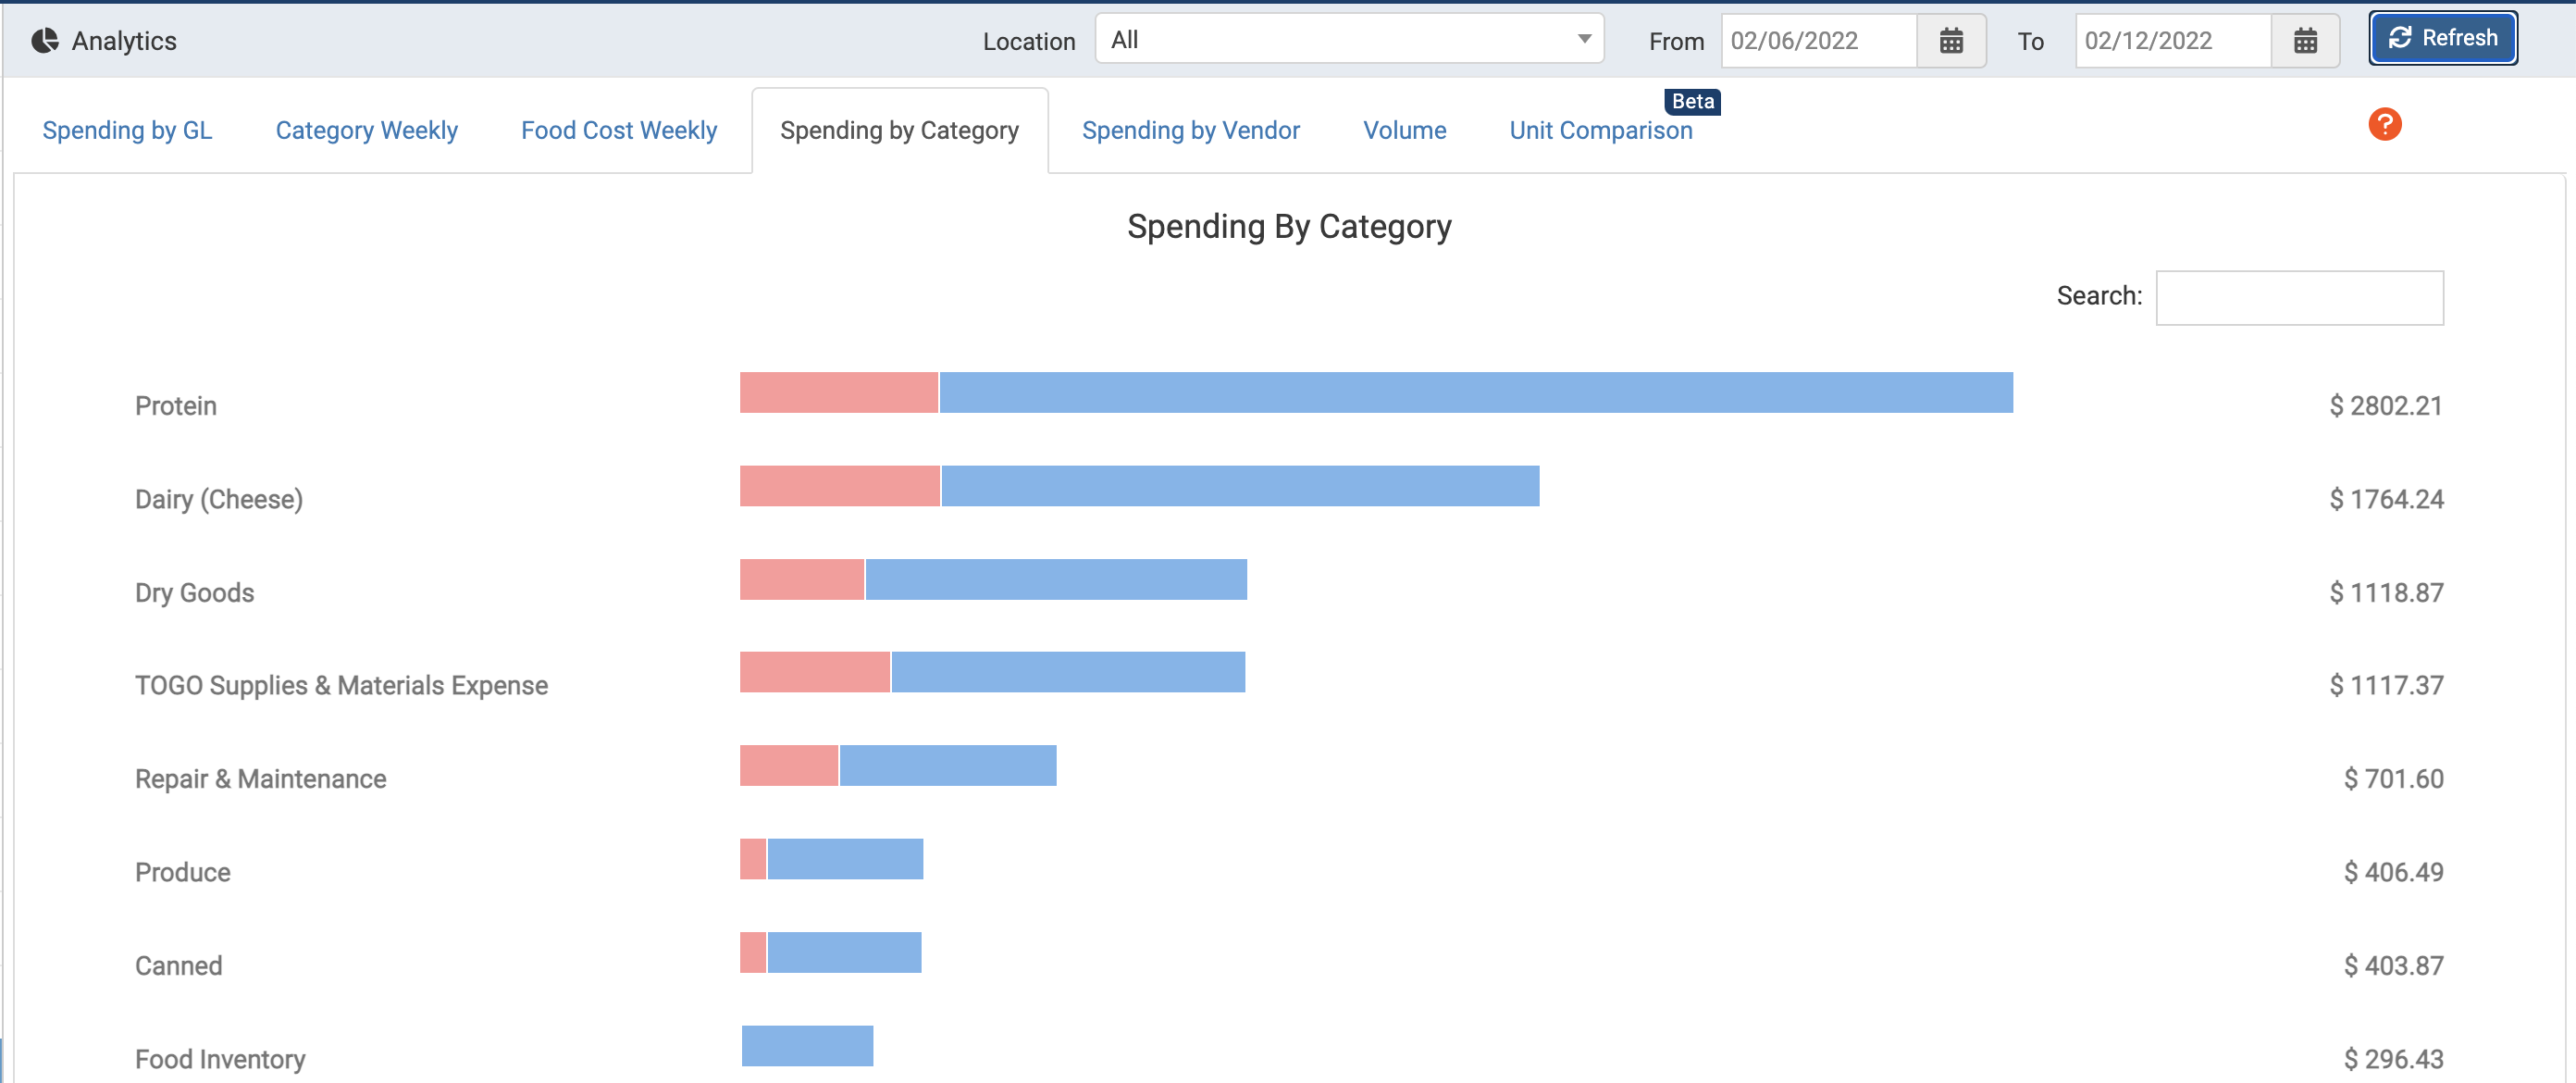
Gastos por categoría
El primer informe que cubriremos es Gastos por categoría. Como puede haber adivinado, este informe se centra en cómo se distribuyen sus gastos en diferentes categorías de xtraCHEF dentro de ciertas ubicaciones y rangos de fechas.
Un desglose completo de este informe se puede encontrar en xtraCHEF: Comience con el análisis de gastos por categoría.
Gastos por GL
Anteriormente llamado Resumen de gastos por GL, este informe le brinda una visión general de todos sus gastos en diferentes ubicaciones durante un cierto período de tiempo. Para comenzar, elige tu rango de fechas y luego selecciona Generar Informe. Una vez poblado, verás tus compras totales y créditos para cada una de tus ubicaciones. Consulta un informe más detallado para cada ubicación seleccionando el botón de flecha hacia abajo en la columna Ver.
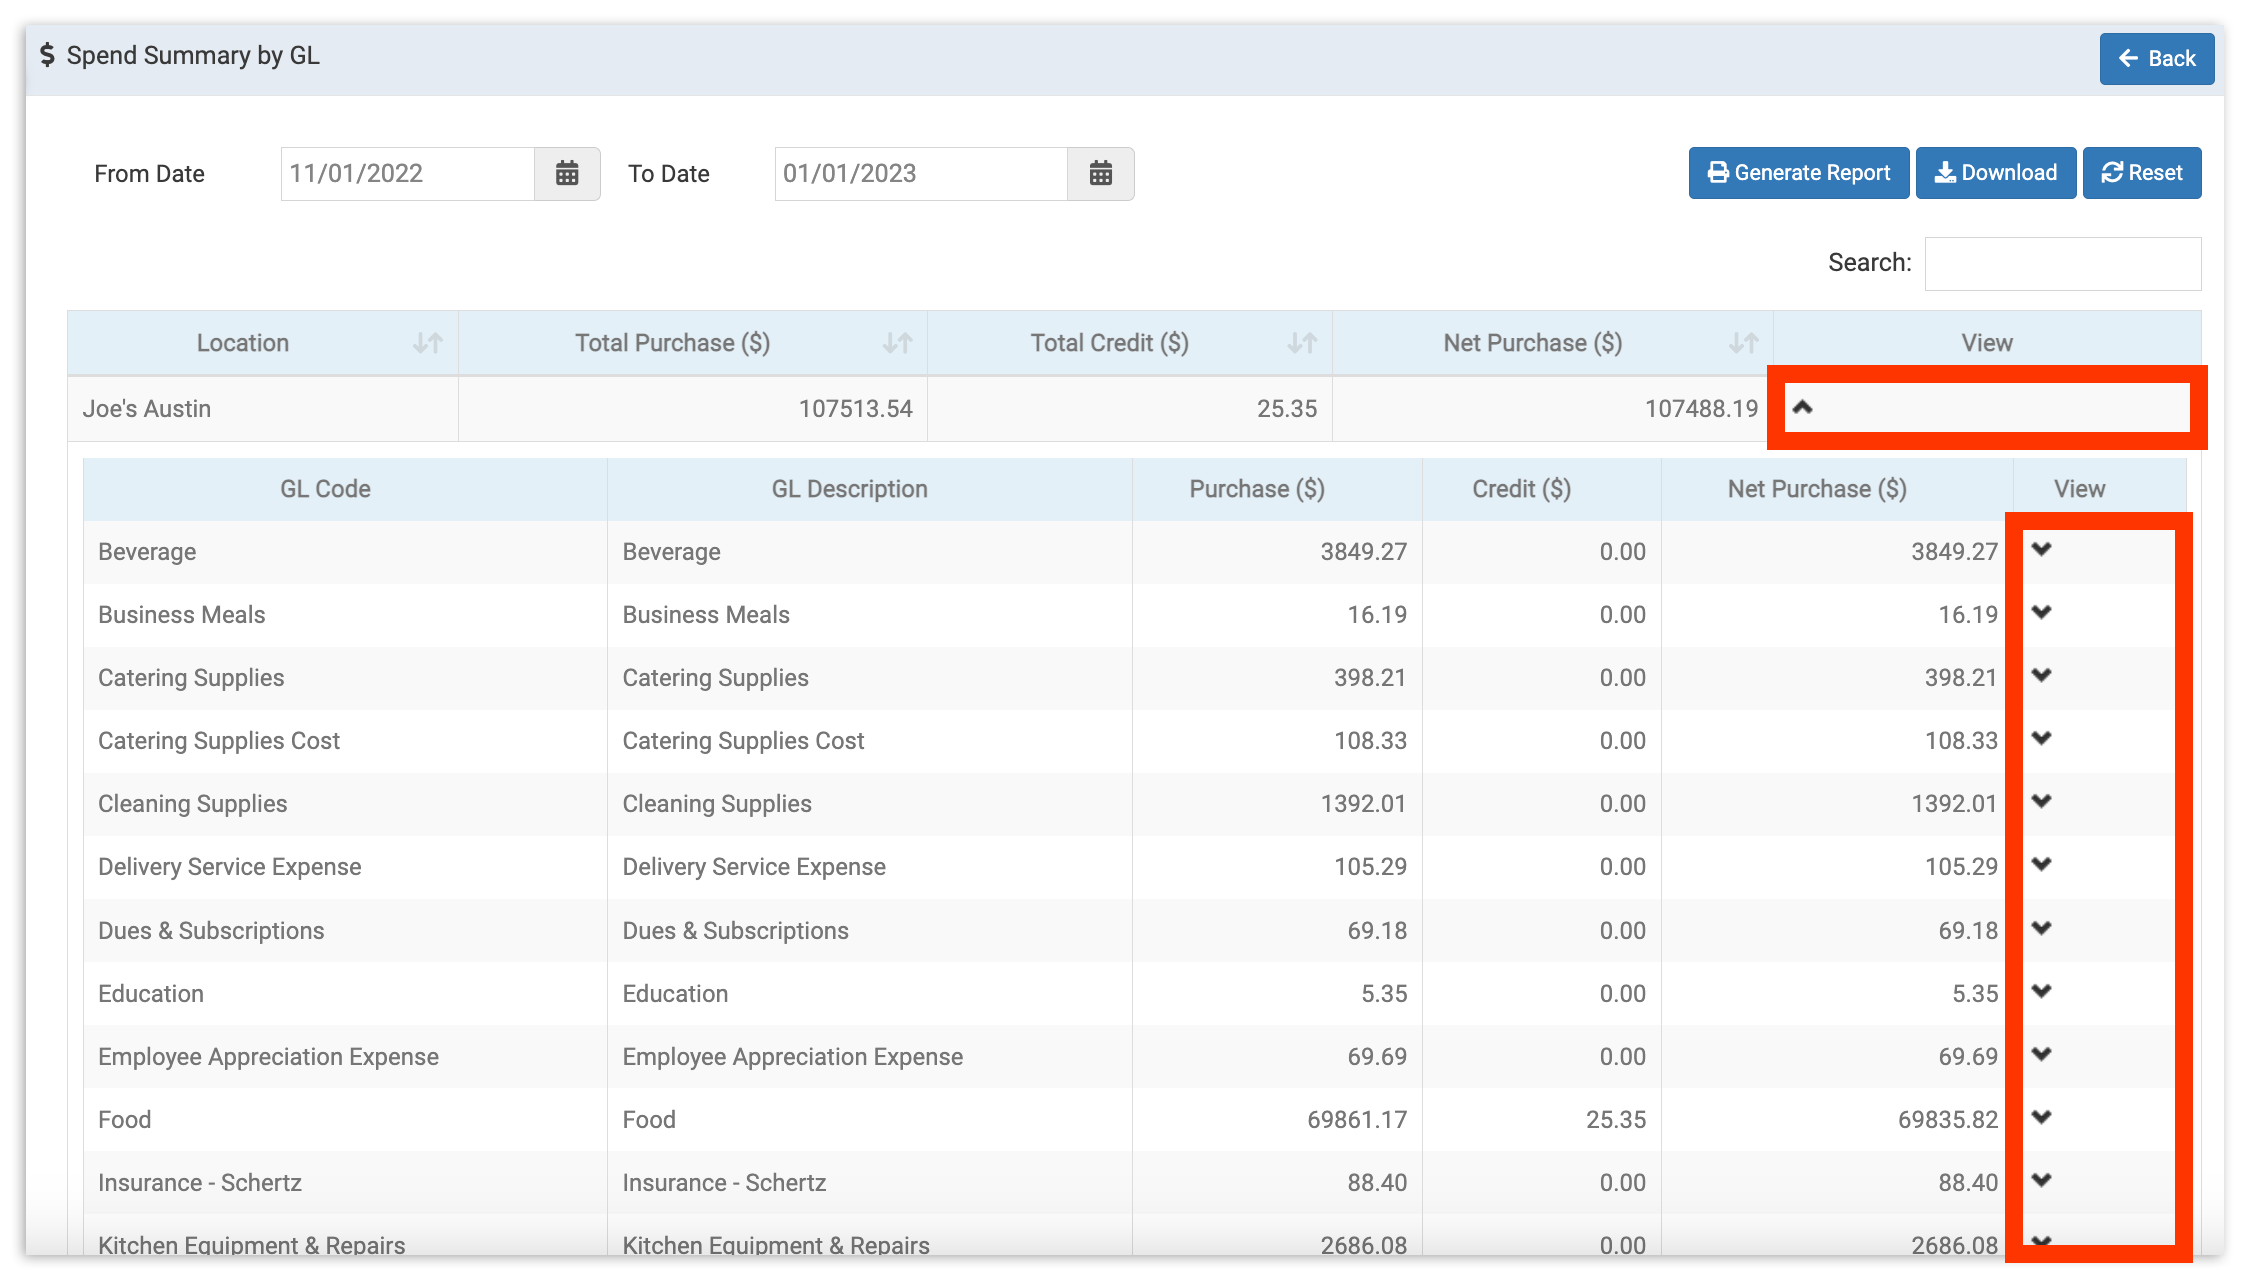
Esto lanzará una lista de todos los códigos GL y sus totales en dólares para el período. Para ver el gasto por categoría, selecciona Ver en la fila del código GL para ver un desglose de compras por categoría. Read xtraCHEF: Comienza con el Análisis de Gastos por GL para más información.
Volver al inicio
Gastos por Proveedor
Este informe desglosa tus gastos por proveedor entre un rango de fechas establecido. Aquí, puedes monitorear o explorar con qué proveedores gastas más y los códigos GL, categorías, y artículos de factura que consumen la mayoría de esos gastos.
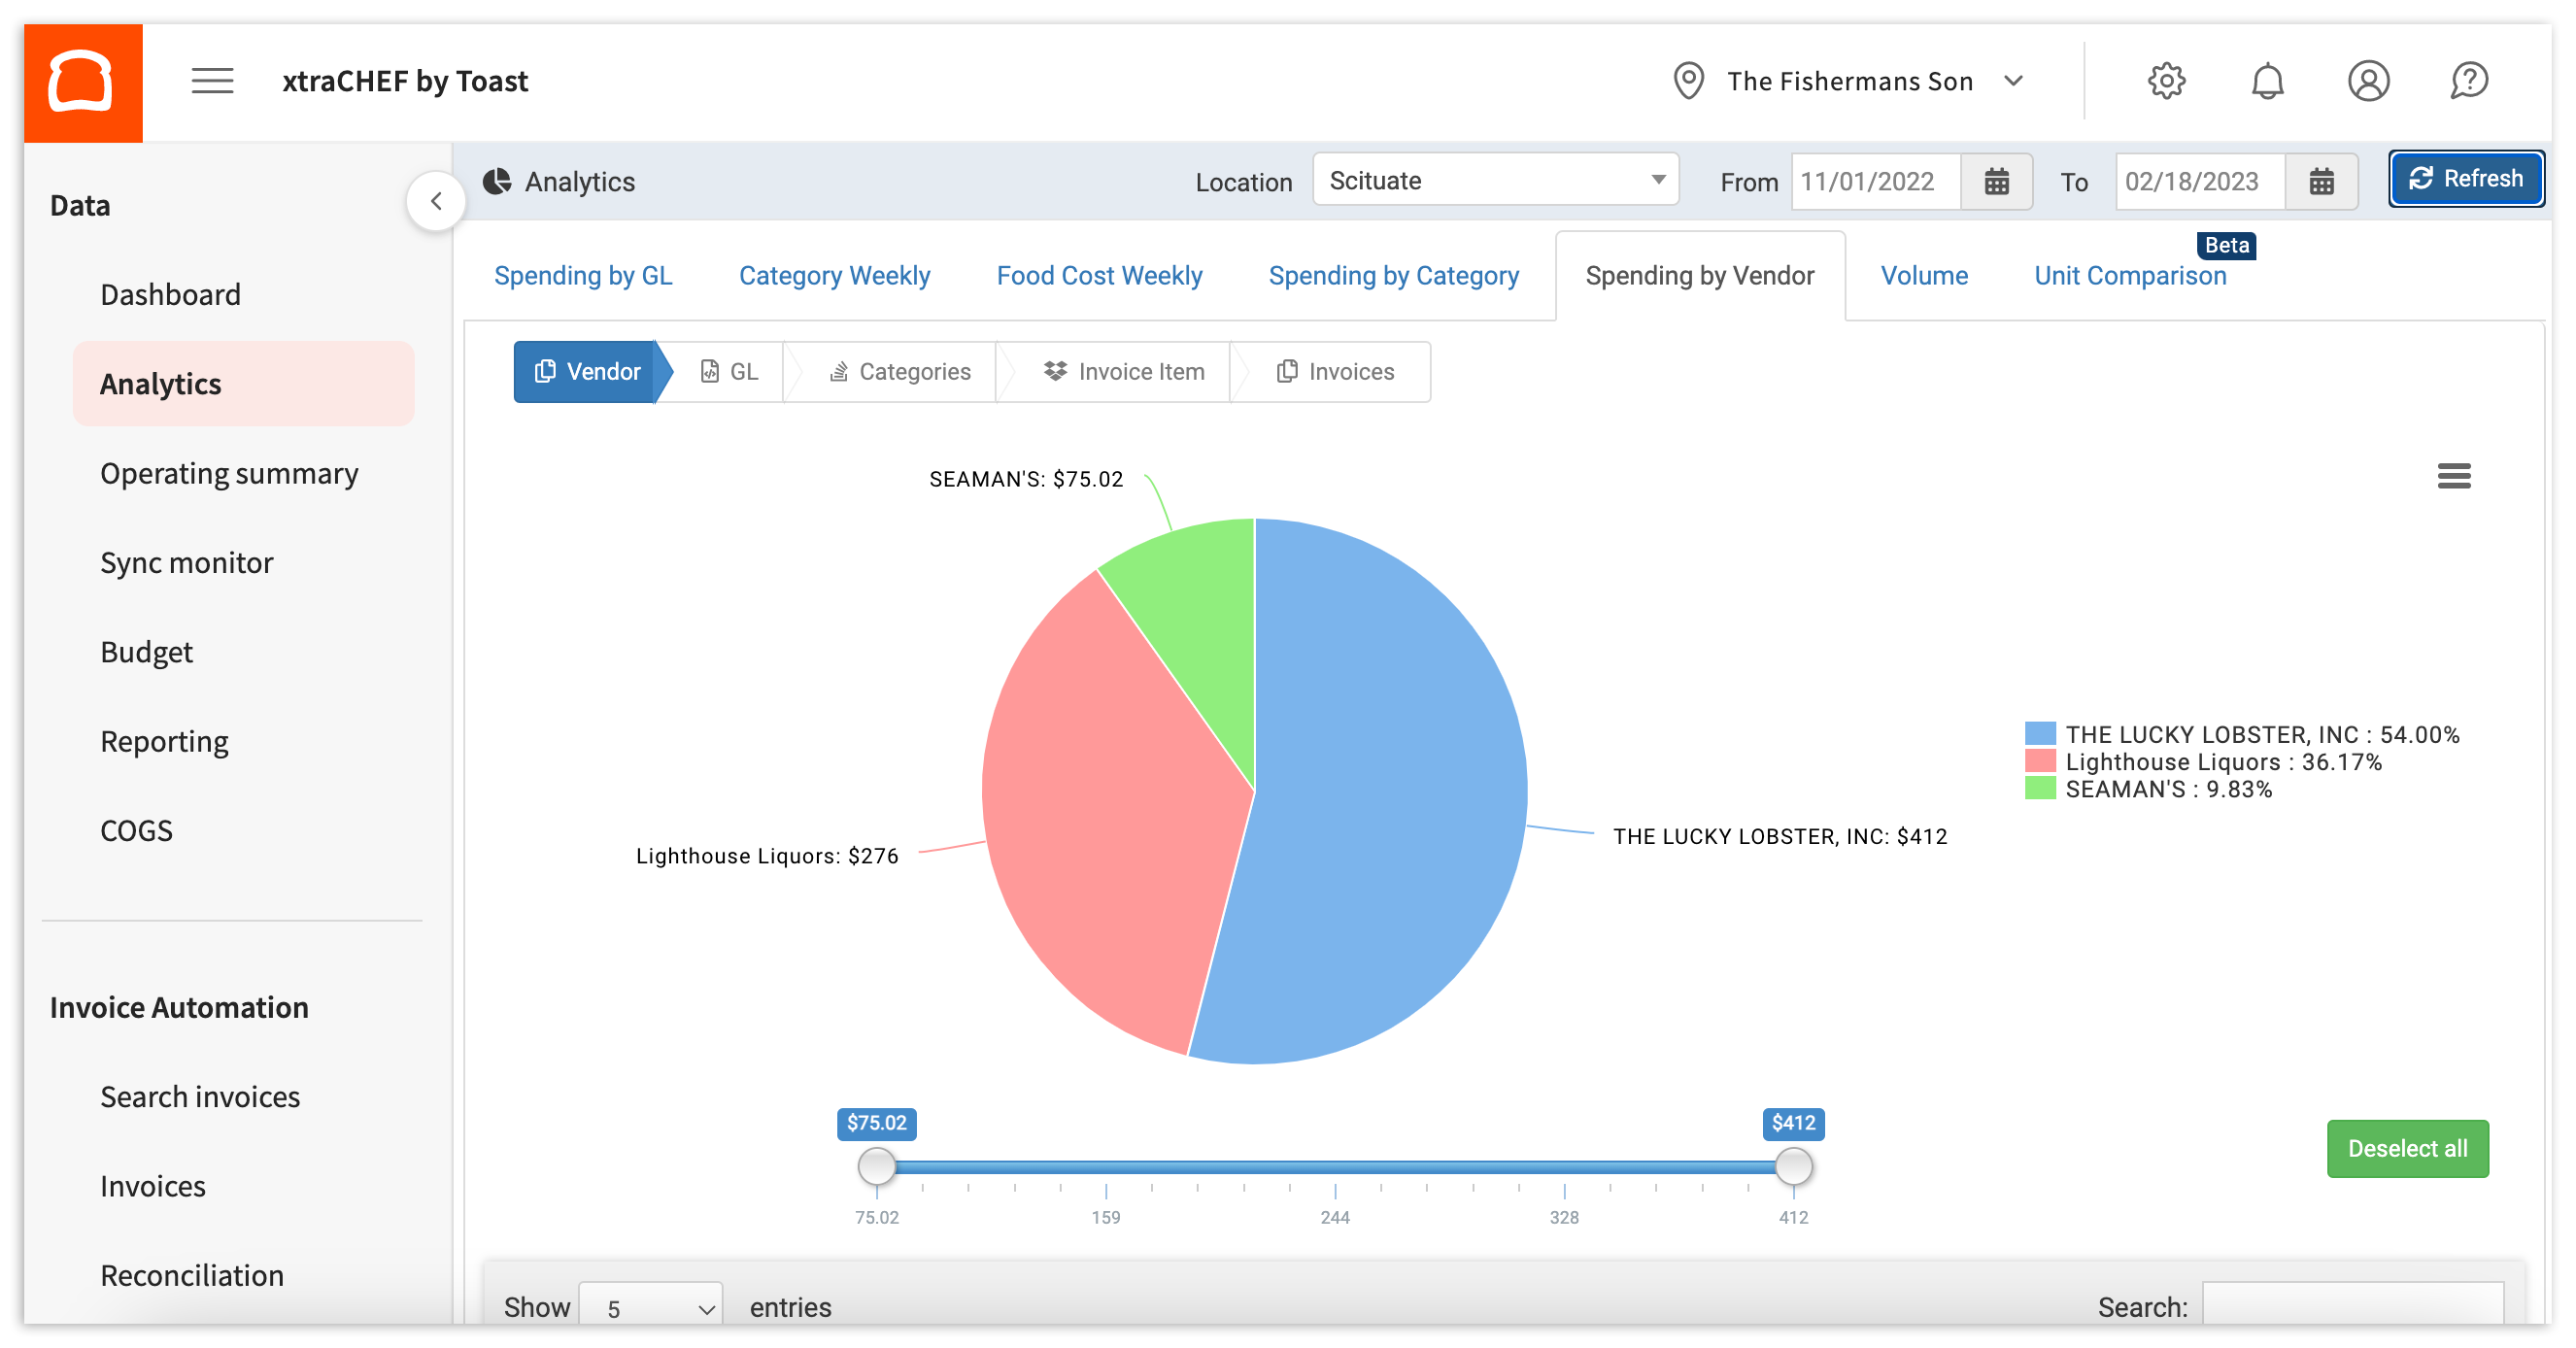
Puedes aprender más navegando a xtraCHEF: Comienza con el Análisis de Gastos por Proveedor.
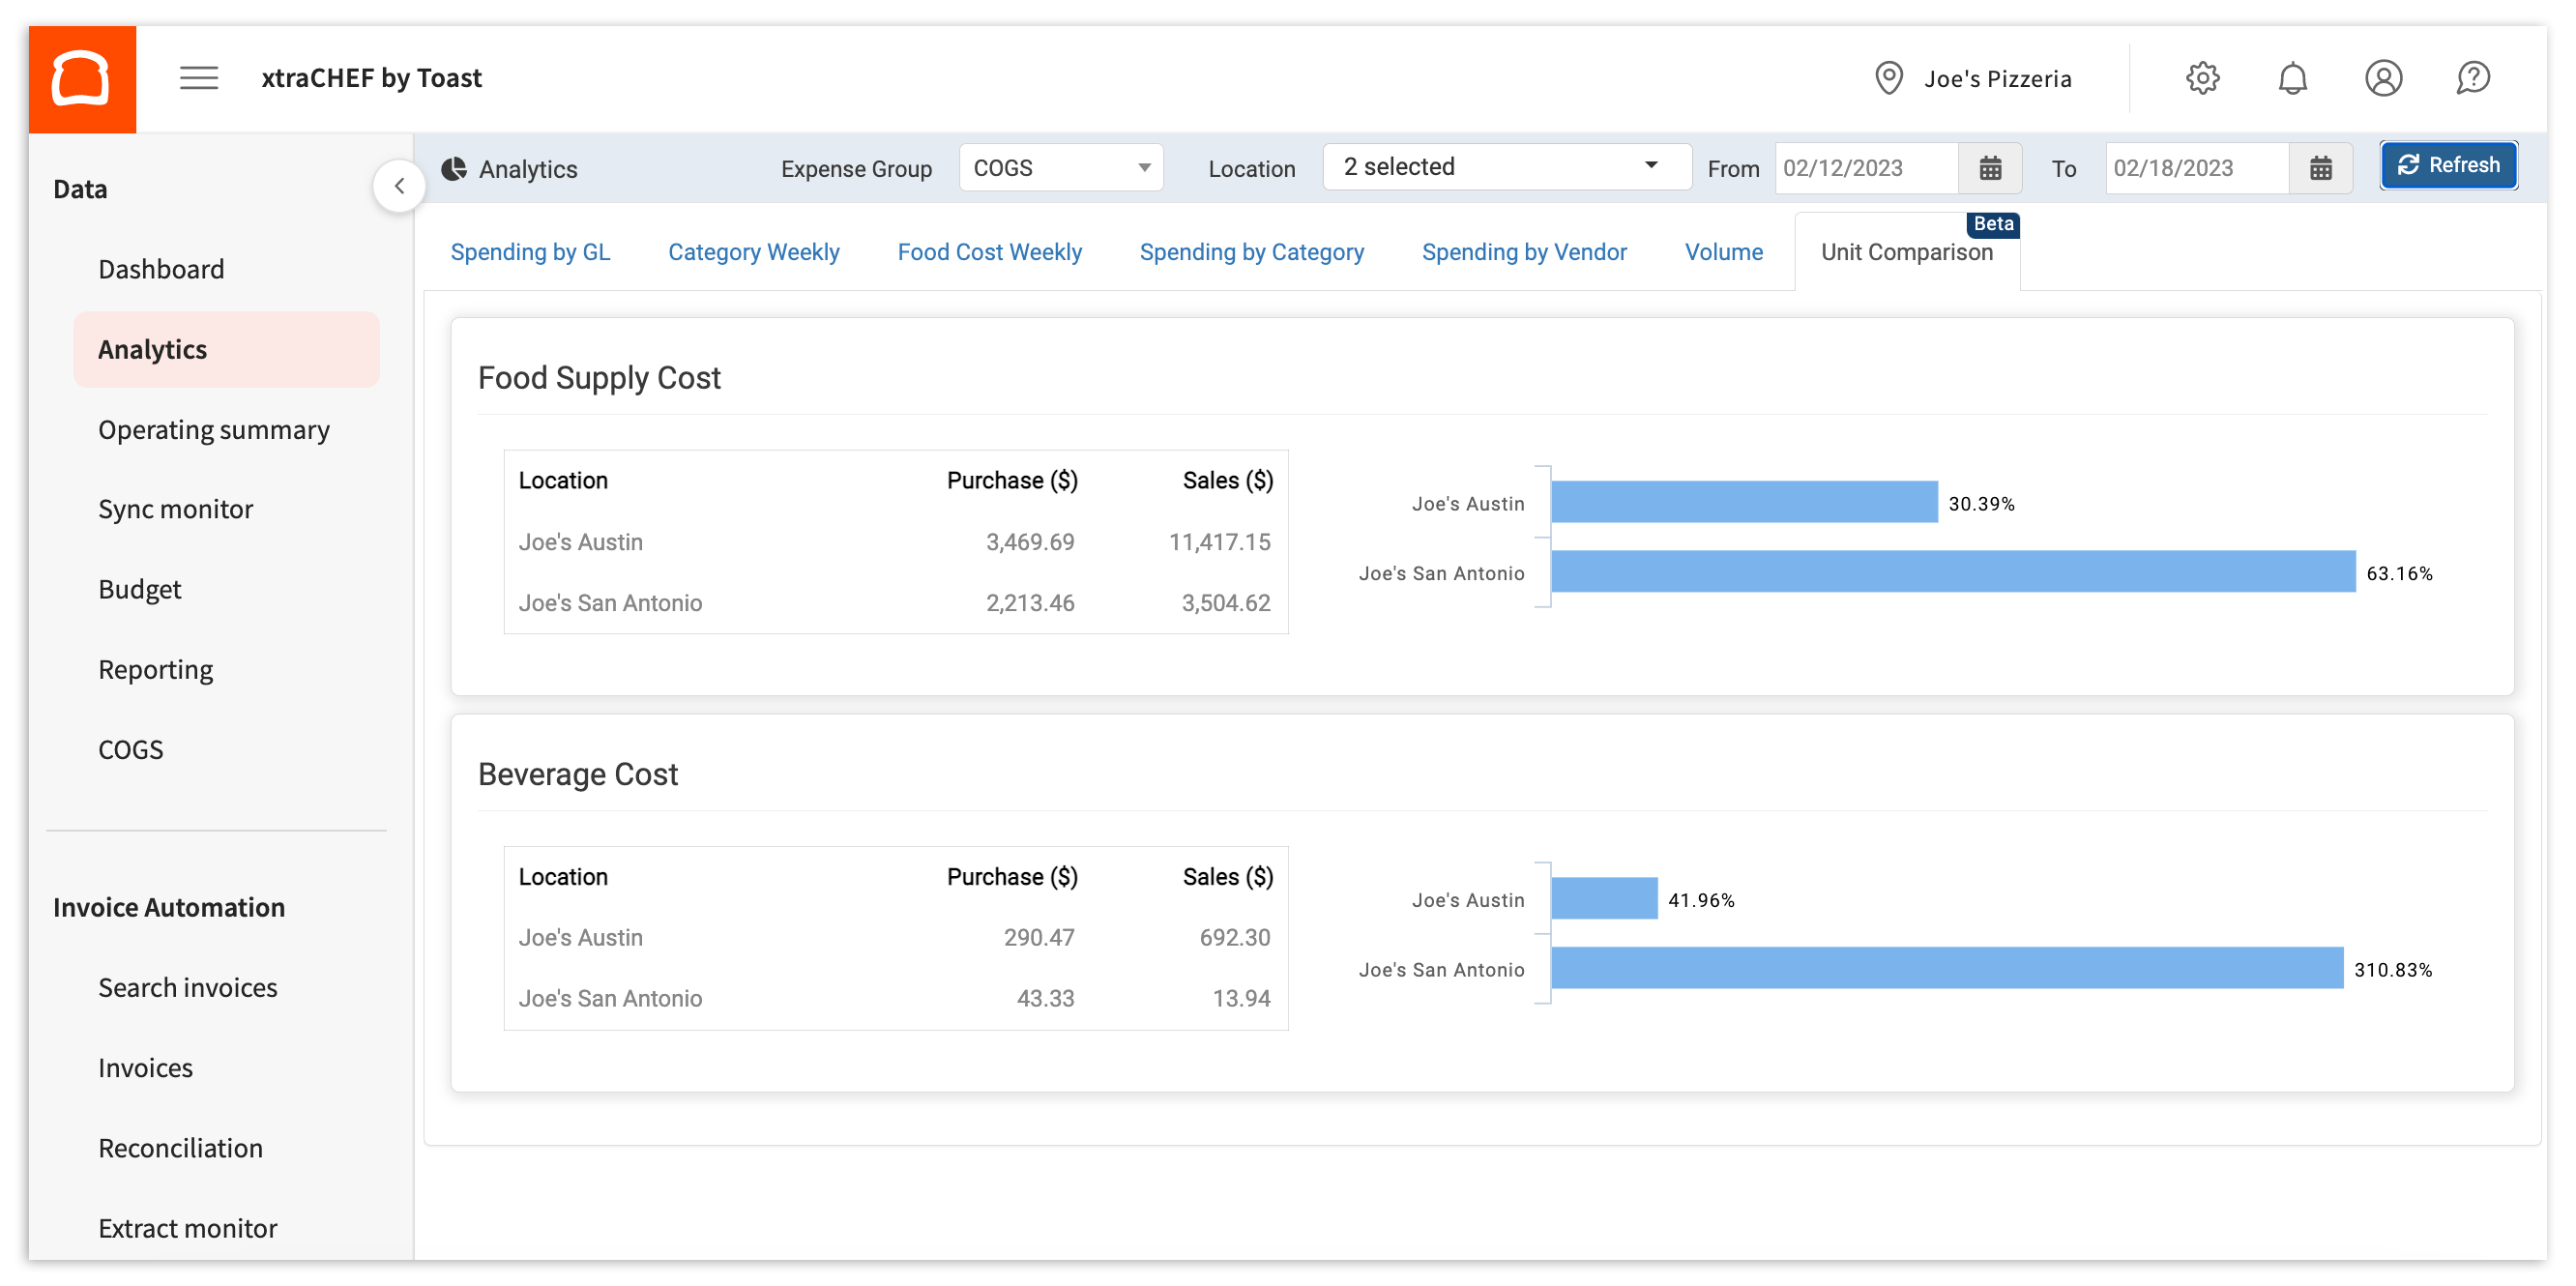
Comparación de Unidades
Este conjunto de análisis es particularmente beneficioso si tienes más de una ubicación bajo tu cuenta de xtraCHEF. La Comparación de Unidades te permite comparar tu gasto por ubicación y ver cómo se comparan tus restaurantes individuales entre sí.
Para más información, consulta xtraCHEF: Comienza con el Análisis de Comparación de Unidades.
Recursos adicionales
- xtraCHEF: Revisar informes en el módulo de informes
- xtraCHEF: Comenzar con los informes de gestión de costos
- xtraCHEF: Revisar informes de análisis