xtraCHEF:开始预算报告
上次更新时间:2026年4月28日 16:19
预算概述
通过xtraCHEF的预算功能,您可以设置预计的销售和支出金额,并在指定的时间范围内跟踪您的实际销售和采购。结果是一个逐渐减少的预算,准确显示您在财务周期内的状态,告知您可能需要进行调整的地方。
这个7分钟的视频教程将带您了解xtraCHEF中的预算报告。
前提条件
在您开始使用预算工具之前,您需要确保完成一些重要的配置步骤。使用此检查清单确保在继续预算设置之前您已准备好一切:
- 完成销售成本(COGS)映射。
- 配置您的会计期间。
- 上传或继续上传发票和收据到xtraCHEF。预算工具需要至少一个月的一致上传,以便报告您的业务支出。
- 已将xtraCHEF与您的Toast POS集成,并完成了销售设置。
- 收集您现有的每月销售数据,并为您未来预期的销售创建估算。
- 确定您的目标食品成本。您将使用此信息来通知您下面设置步骤中的预算预测。 如果您依赖现有预算,请准备将其导入xtraCHEF。
一旦您拥有良好的数据基线,您就可以开始使用预算工具来管理您的收入和支出。
预算设置
要导航到预算页面,请从左侧导航栏中选择预算。此页面包含三个选项卡:主要的仪表板(默认视图)、您的预算创建器,以及一个导入选项卡,允许您导入现有的预算信息。
手动添加或编辑预算信息
为了用预计销售和预算估算值填充您的预算工具,您首先需要输入您的每月预算。您可以通过以下步骤手动完成此操作,或者填写并导入预算模板。 如果您已经按会计期间建立了预算,导入是配置的最快方法。
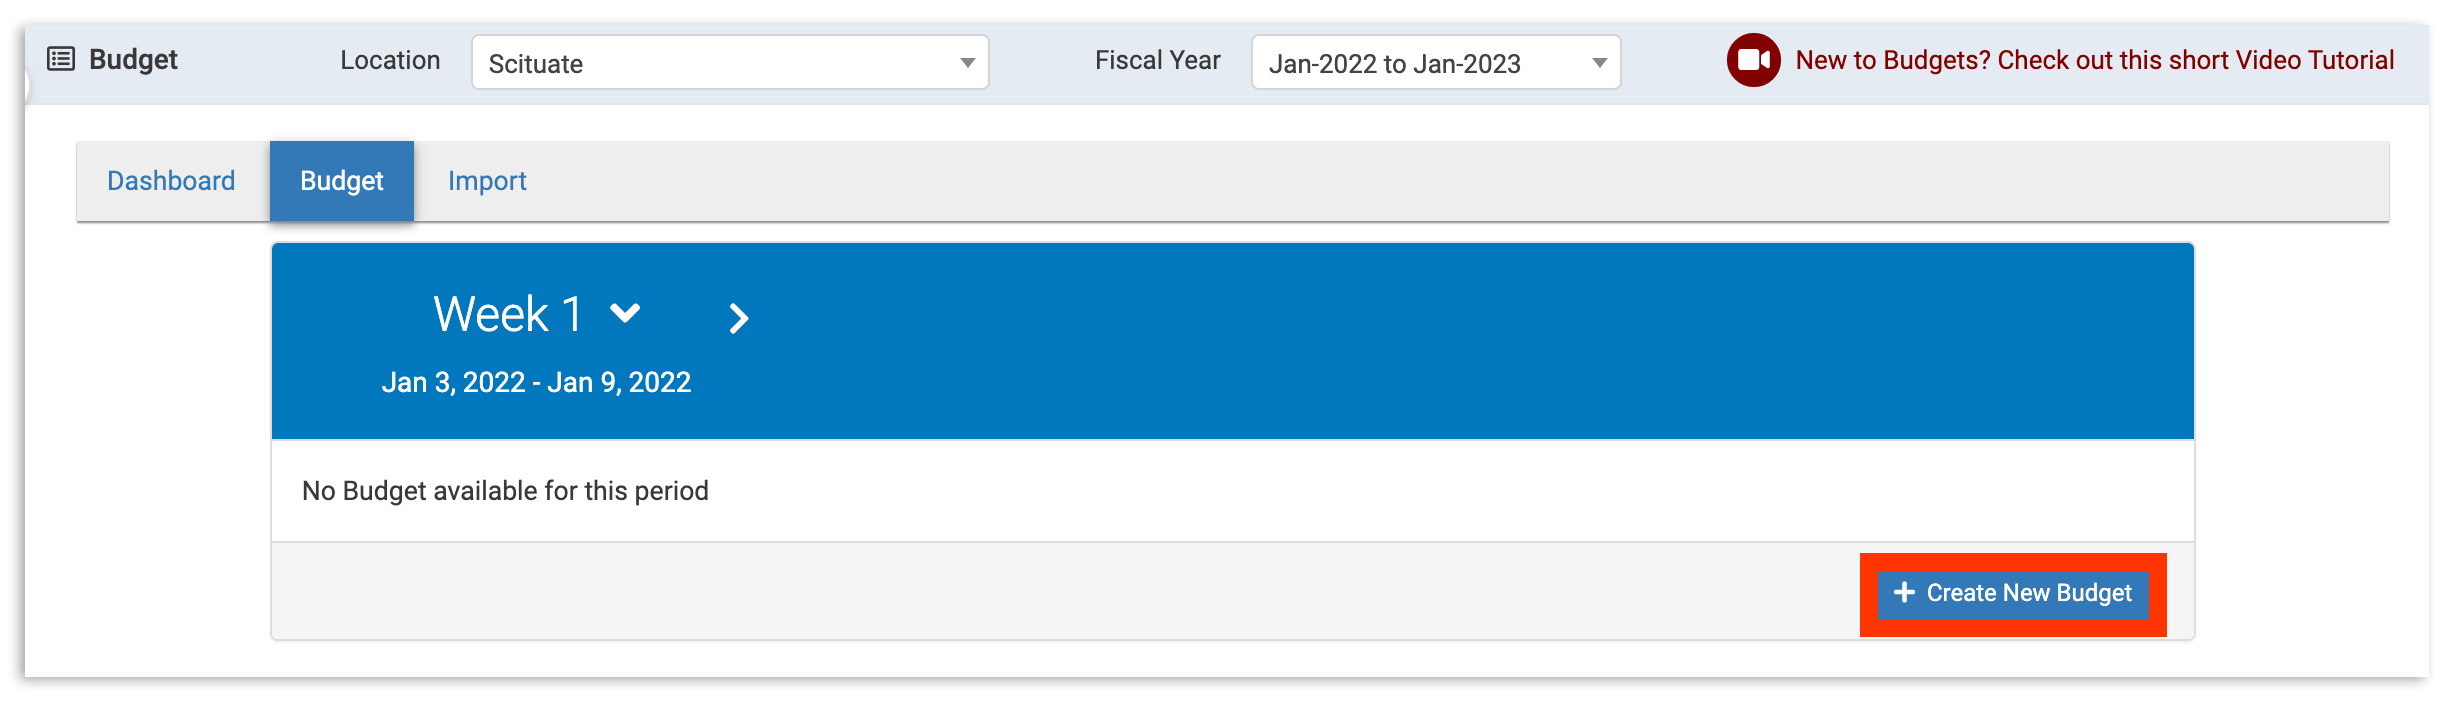
要手动输入您的每月预算,请选择预算选项卡。在该选项卡上方,选择您希望建立预算的地点和财政年度。 然后选择+创建新预算。
然后系统会提示您选择复制上个月预算(如适用)或通过空预算创建新值。
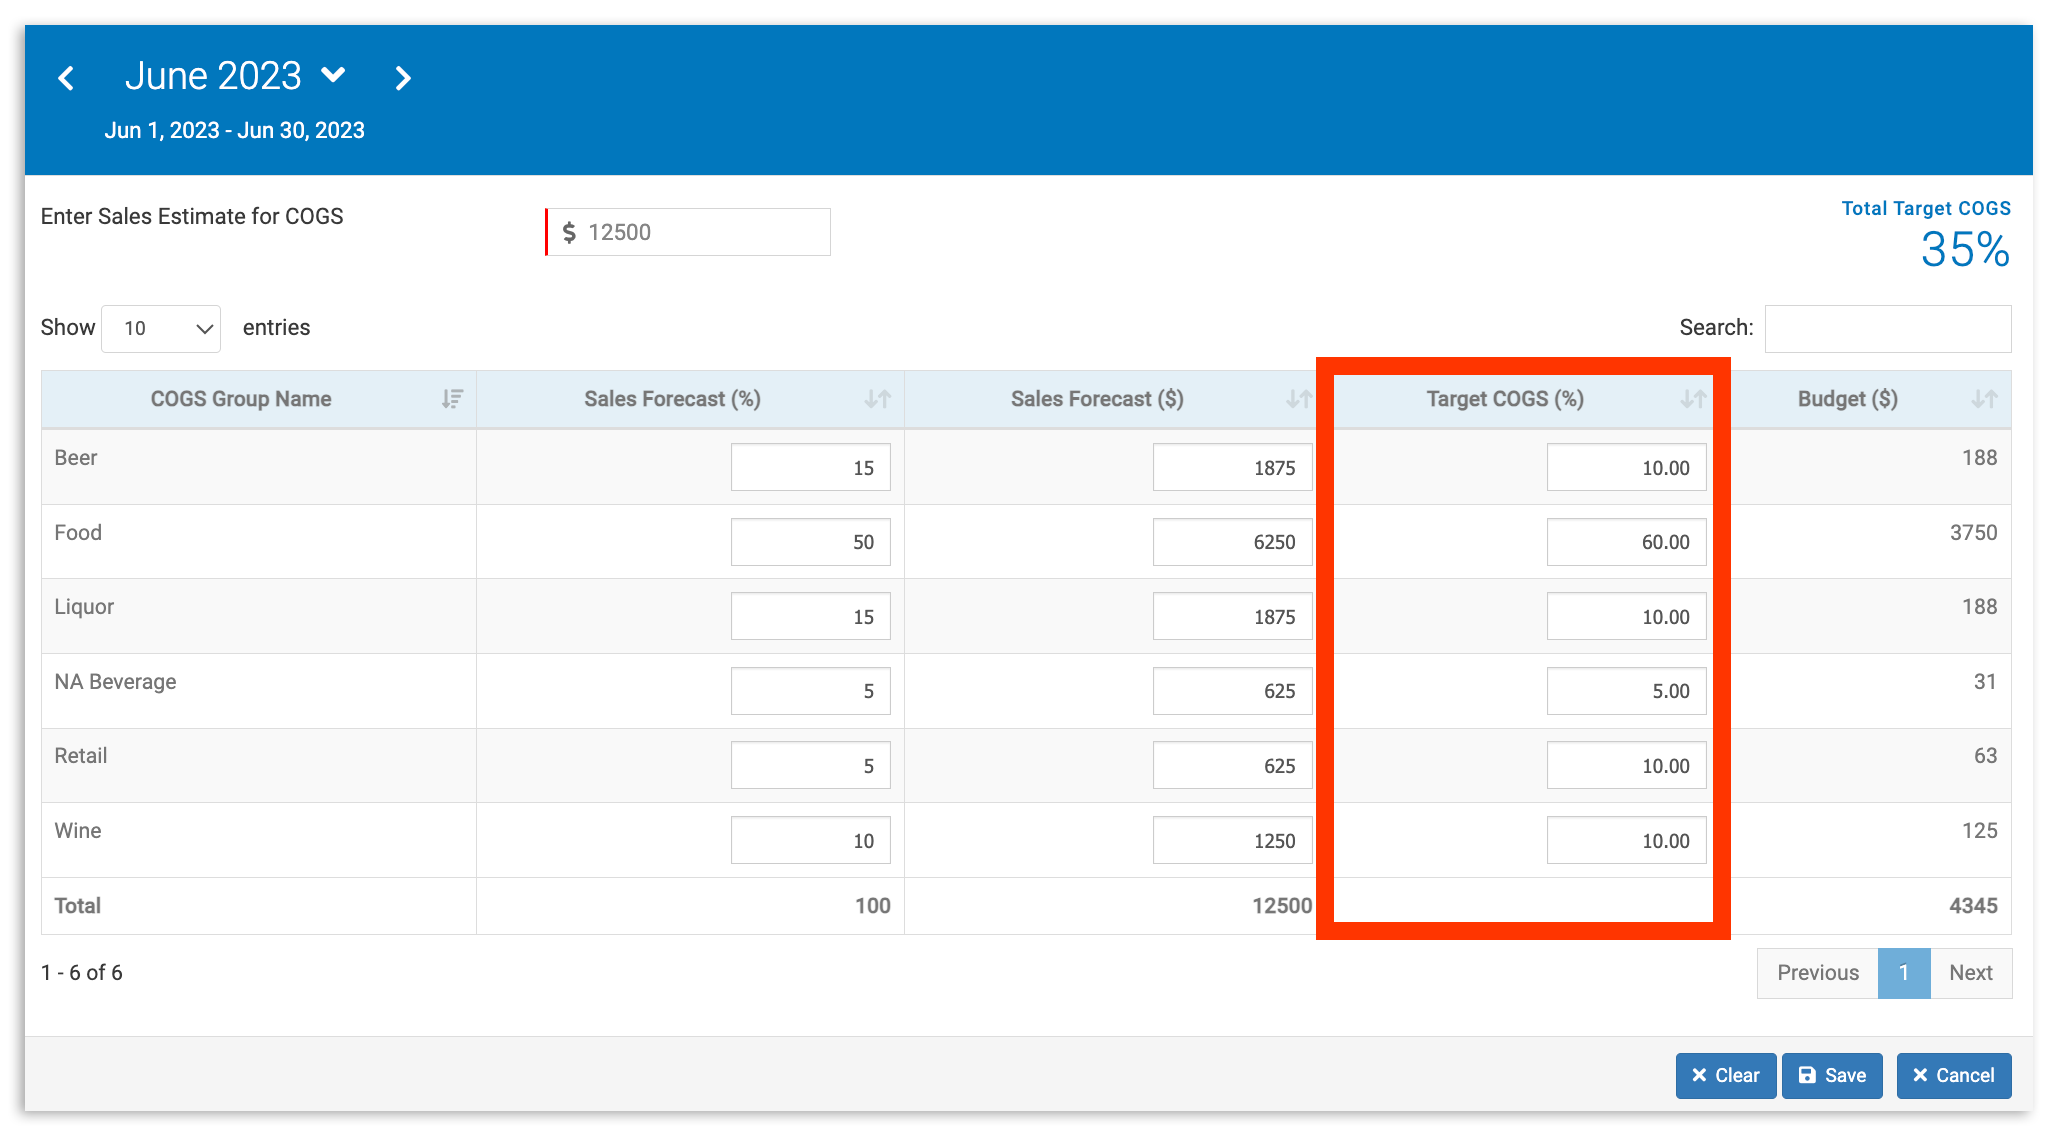
如果您选择空预算,系统会提示您输入销售估算以计算销售成本。 这是您在该期间的总支出(由您的会计期间设置决定)。您还可以按销售成本组将总销售估算分配,按百分比(%)或美元($)应用销售预测值。这样做将使您能够在稍后监控每个销售成本的预算。
注意: 您的销售成本组会自动从现有数据中提取,无法在此处编辑 - 如果您需要添加或更新销售成本,必须单独进行。
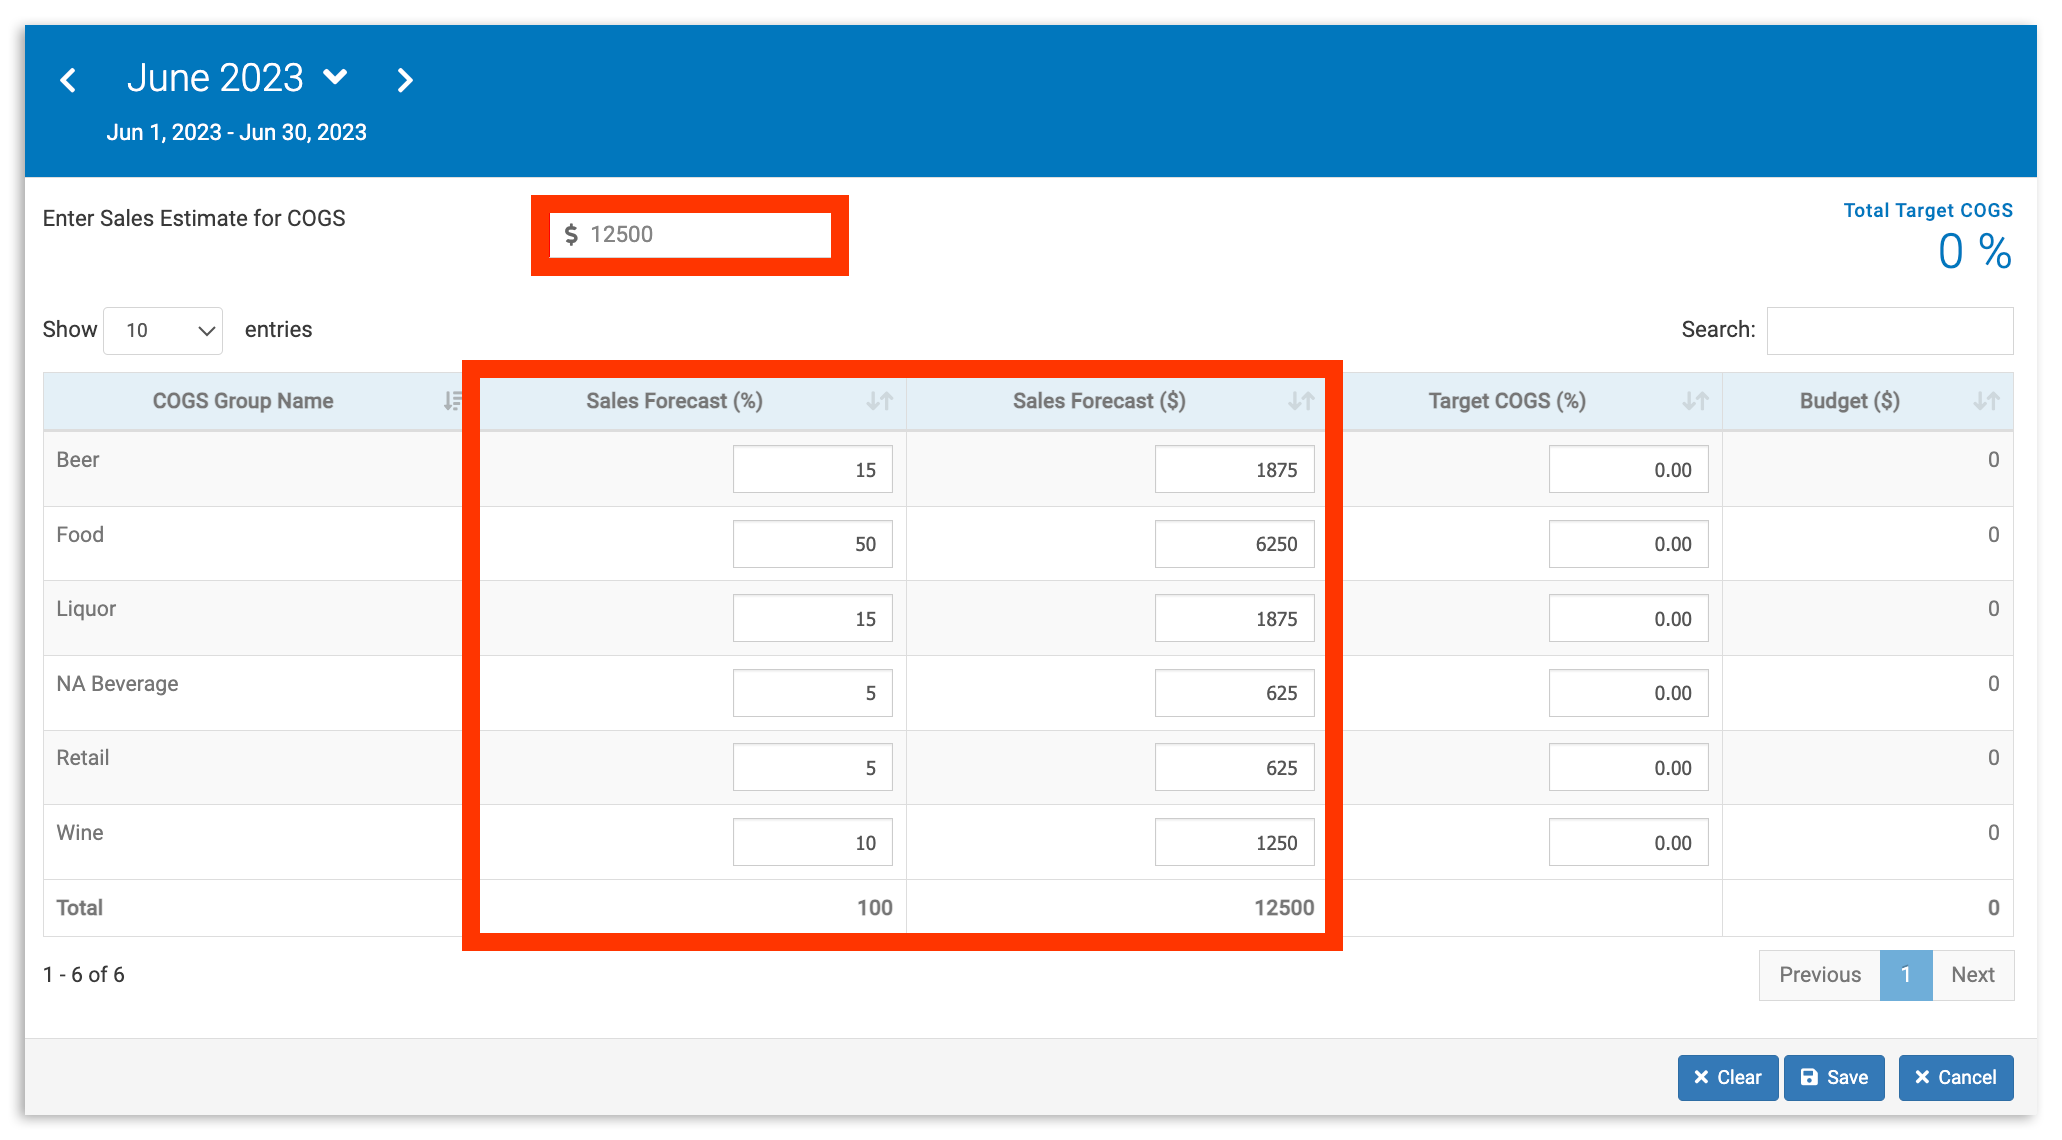
接下来,指明您每个期间的目标销售成本 (%)。为此,您首先需要确定计划在每个销售成本组上花费的总月收入。请记住,这些百分比不一定与您的预计收入相关。
添加预算数字后,选择保存。然后会出现确认消息,通知您新的预算已成功添加。
导入现有预算
您的组织是否已经有预算信息?您可以以电子表格格式导入这些数据,而不是手动为每个期间添加信息。要开始,请选择导入选项卡。
您的导入数据需要符合我们的电子表格模板,以便成功导入。要下载此模板,请选择下载预算模板。这将下载一个名为"BudgetTemplate.xlsx"的文件。
要填写此模板,请从计算机中打开该文件。加载后,您将进入一个名为备注的选项卡,其中包含填写和导入模板电子表格的一般指南。通过选择 预算(如下所示)进行操作。
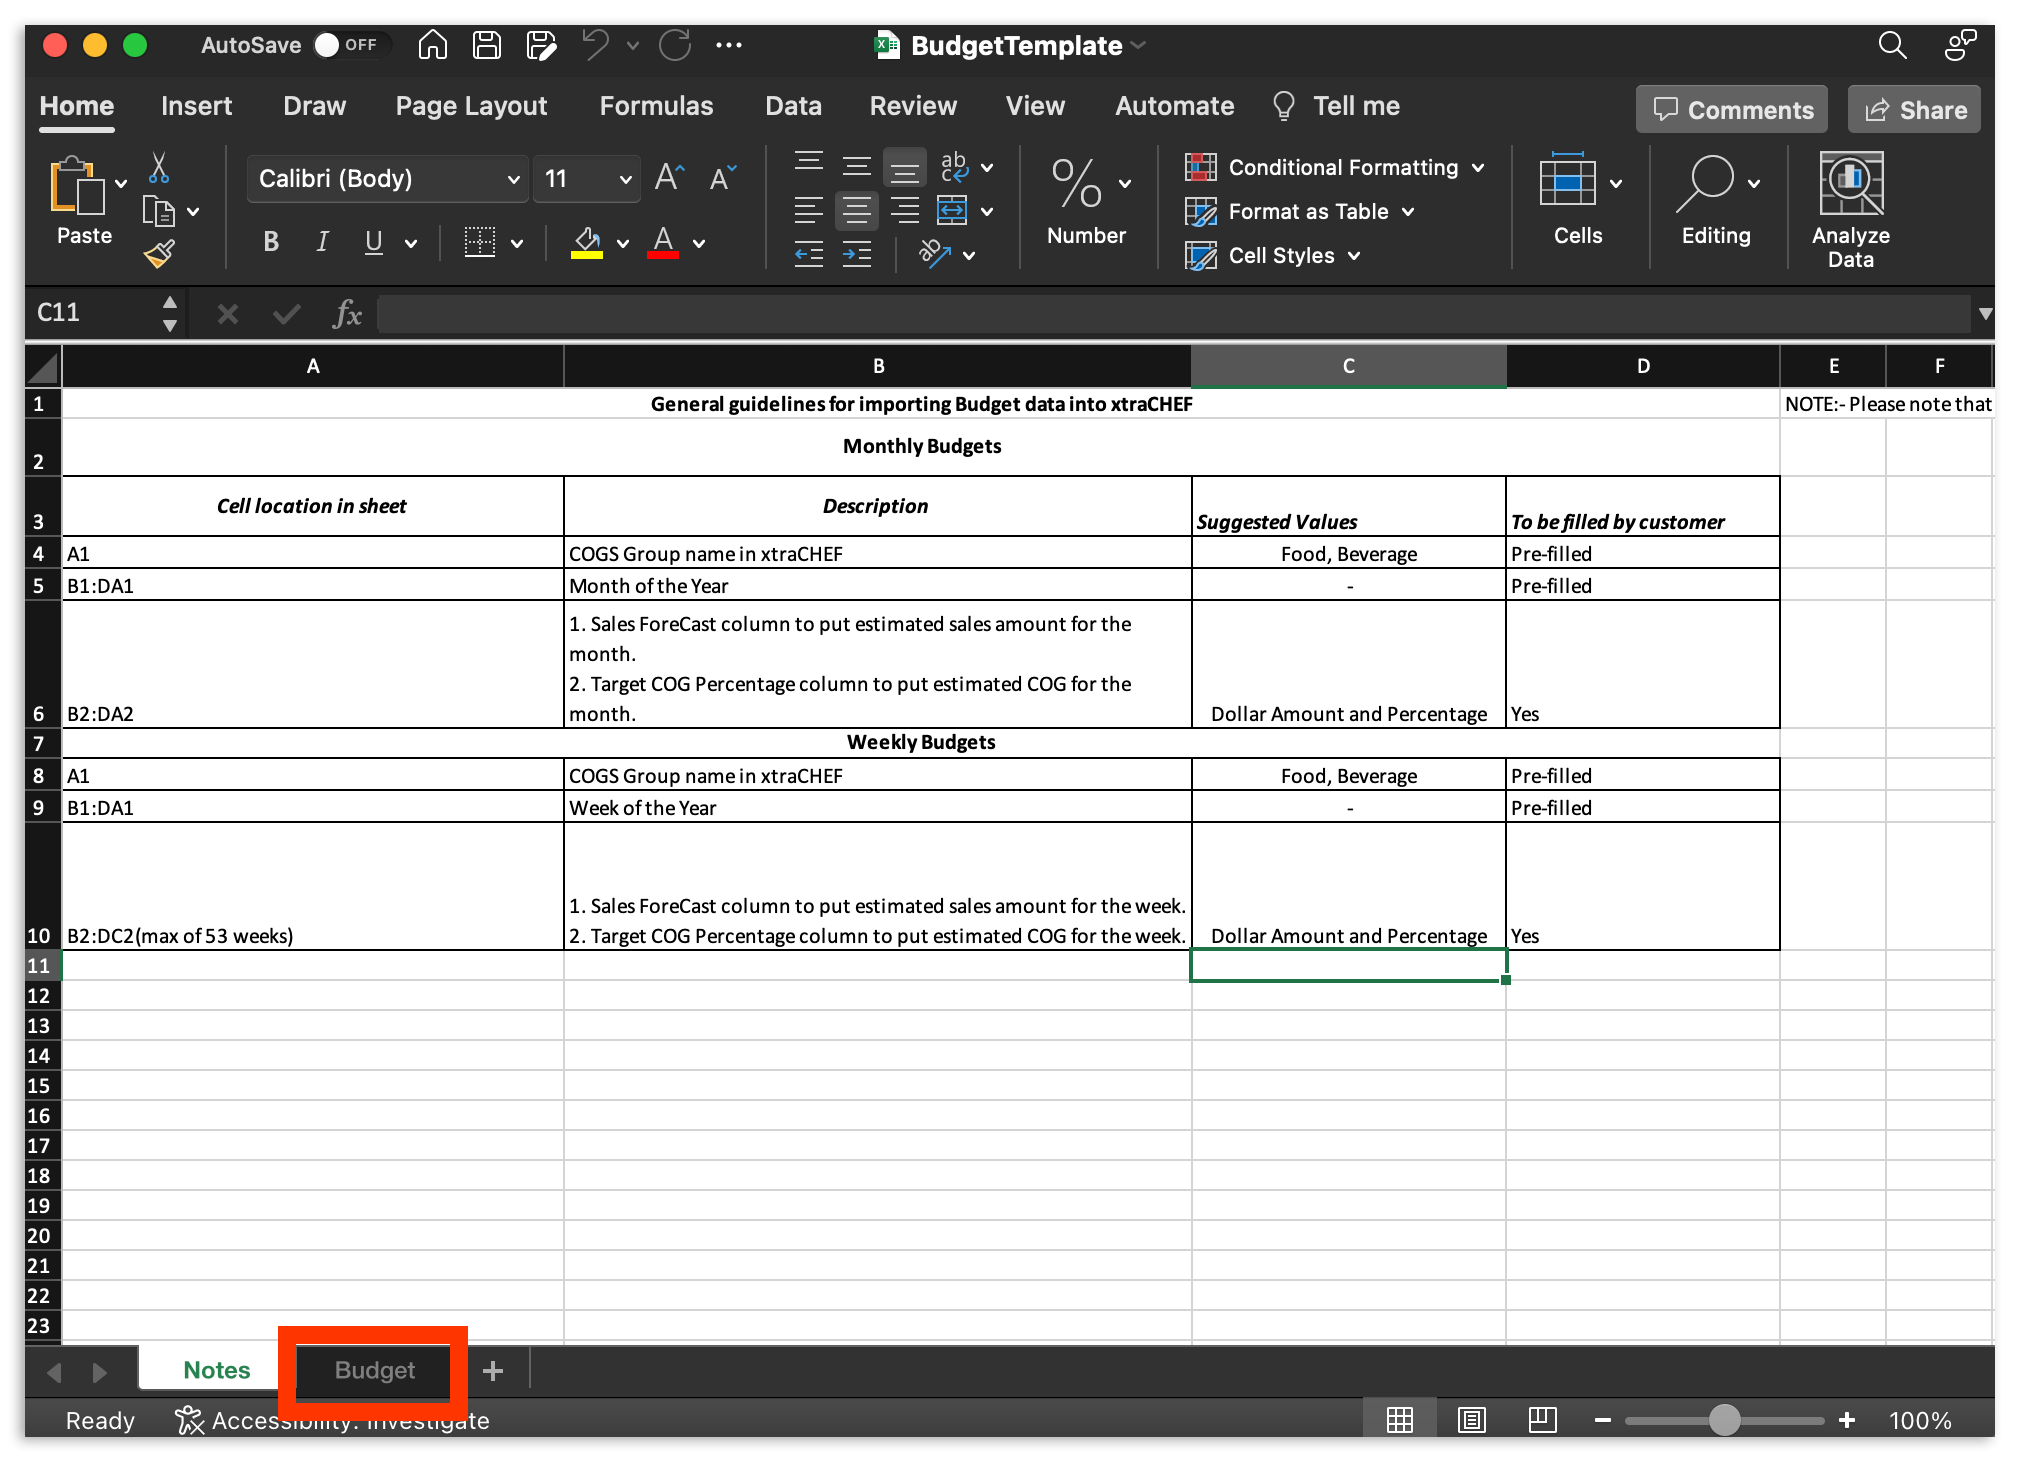
您的预算选项卡将显示电子表格字段。
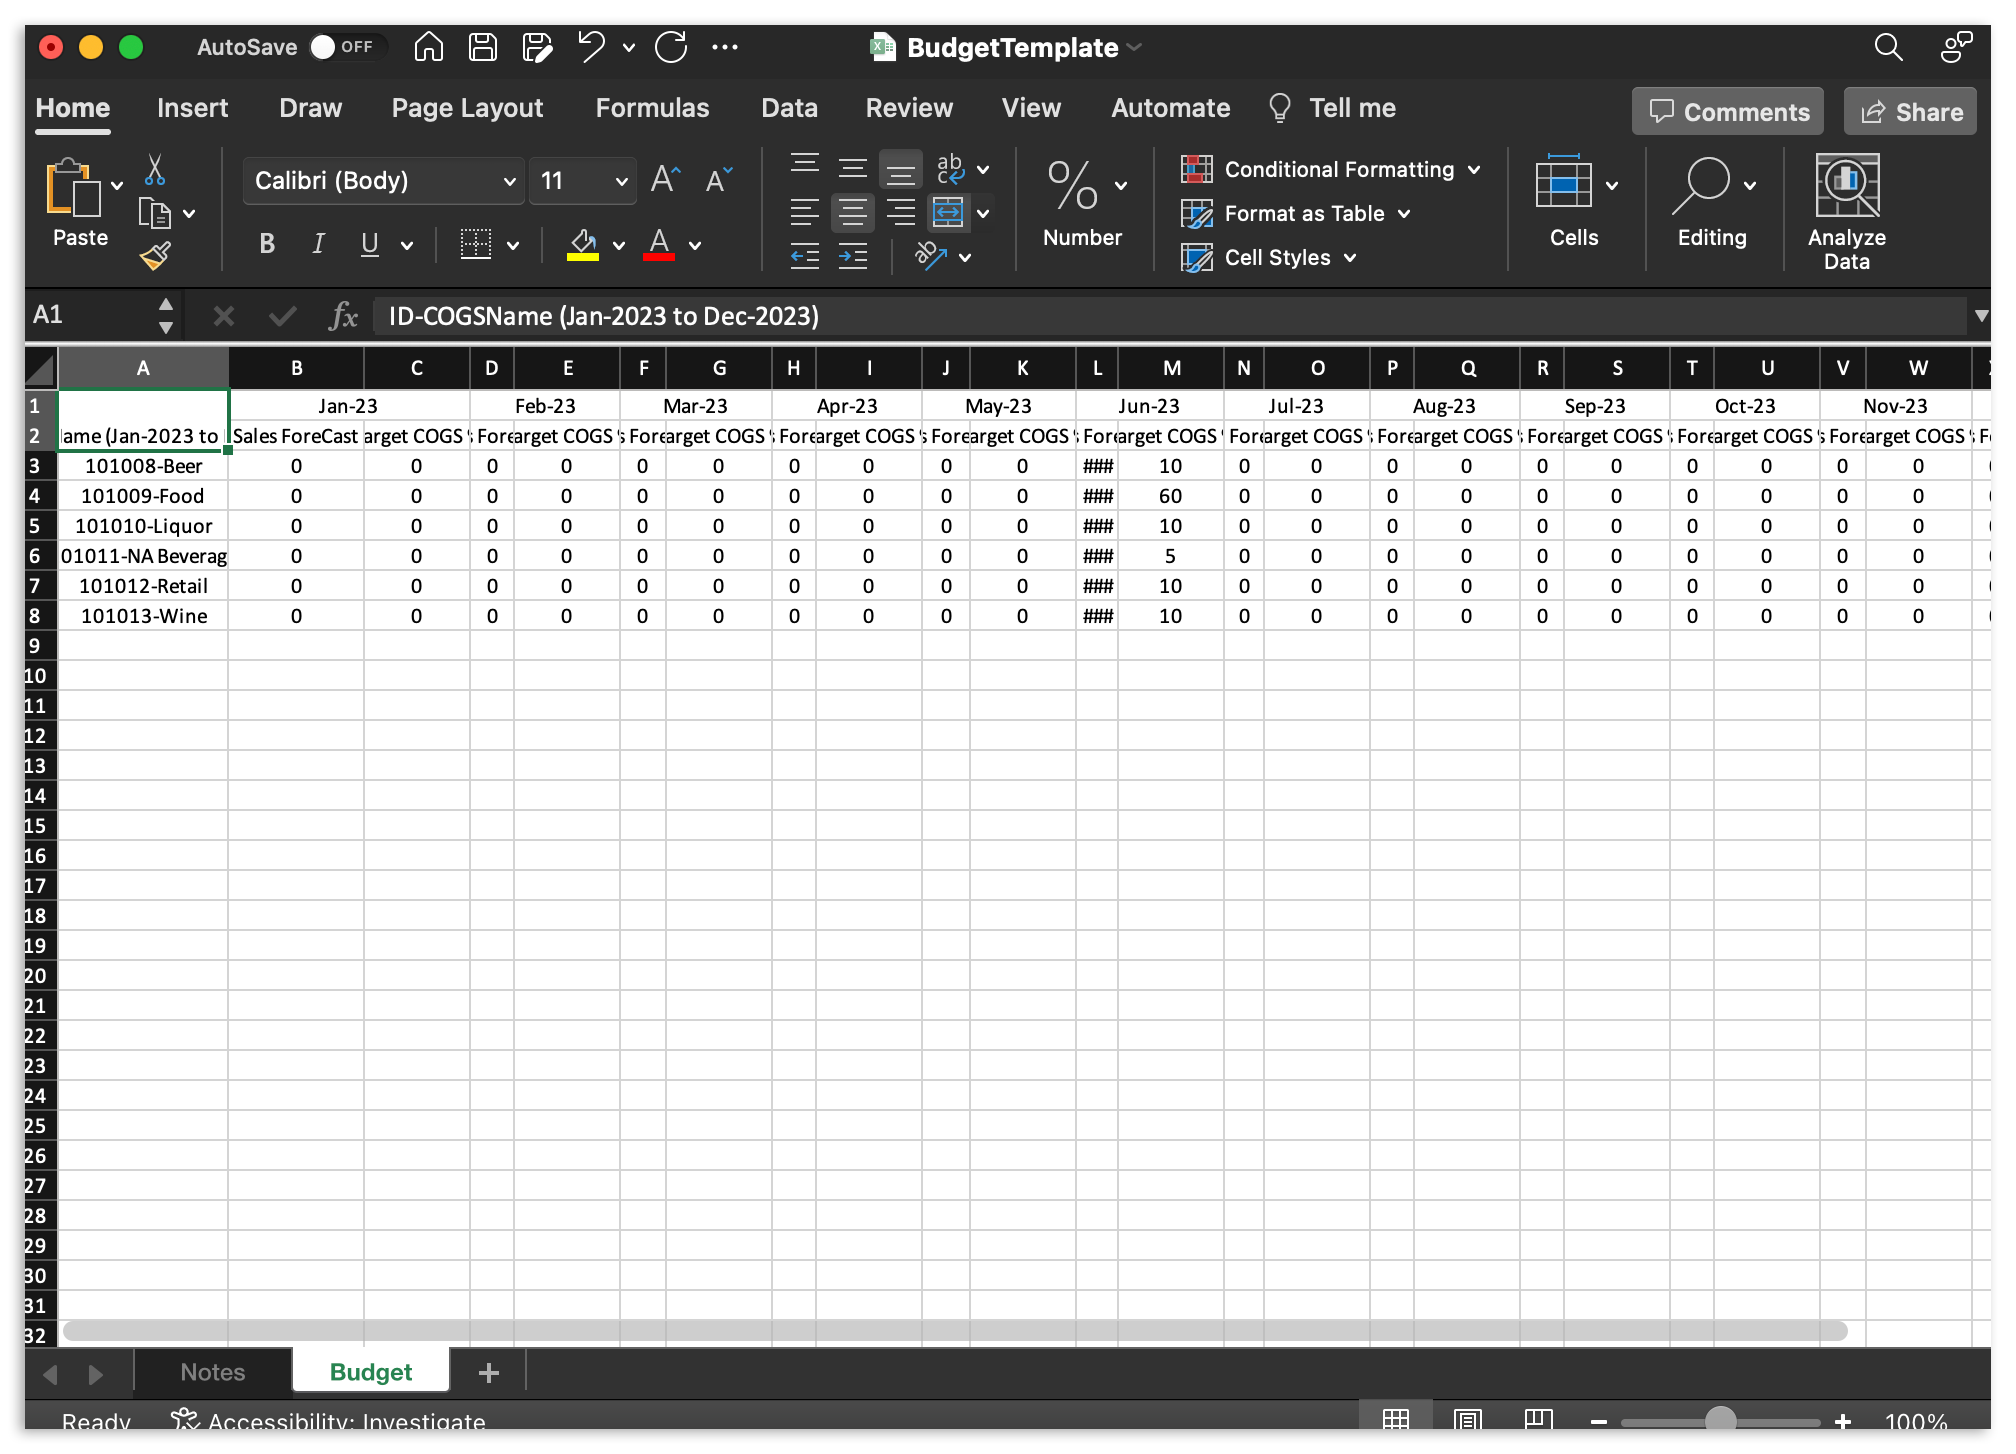
| 行或列 | 描述 |
| 第 1 行 | 请勿编辑此行。此字段由您填写,并标记 会计期间。 |
| 第 2 行 | 请勿编辑此行。此字段由您填写,并将列标记为 销售预测 或 目标 COGS。 |
| A 列 | 请勿编辑此列。此列由您填写,并标记您的销售预测或目标 COGS 值将报告的 COGS 组/总账代码。 |
继续为您的会计期间分配 销售预测 金额和 目标 COGS 百分比。当您的电子表格准备好后,将其保存到计算机并返回 xtraCHEF。
在 xtraCHEF 中,选择 导入预算。 这将提示您从计算机中选择文件。选择文件并完成您的预算导入。
注意:对于多单位操作,请确保您将电子表格上传到正确的位置。
如何使用您的预算工具
一旦您通过预算或导入选项卡输入了您的信息,您就可以开始使用这些数据。
预算仪表板
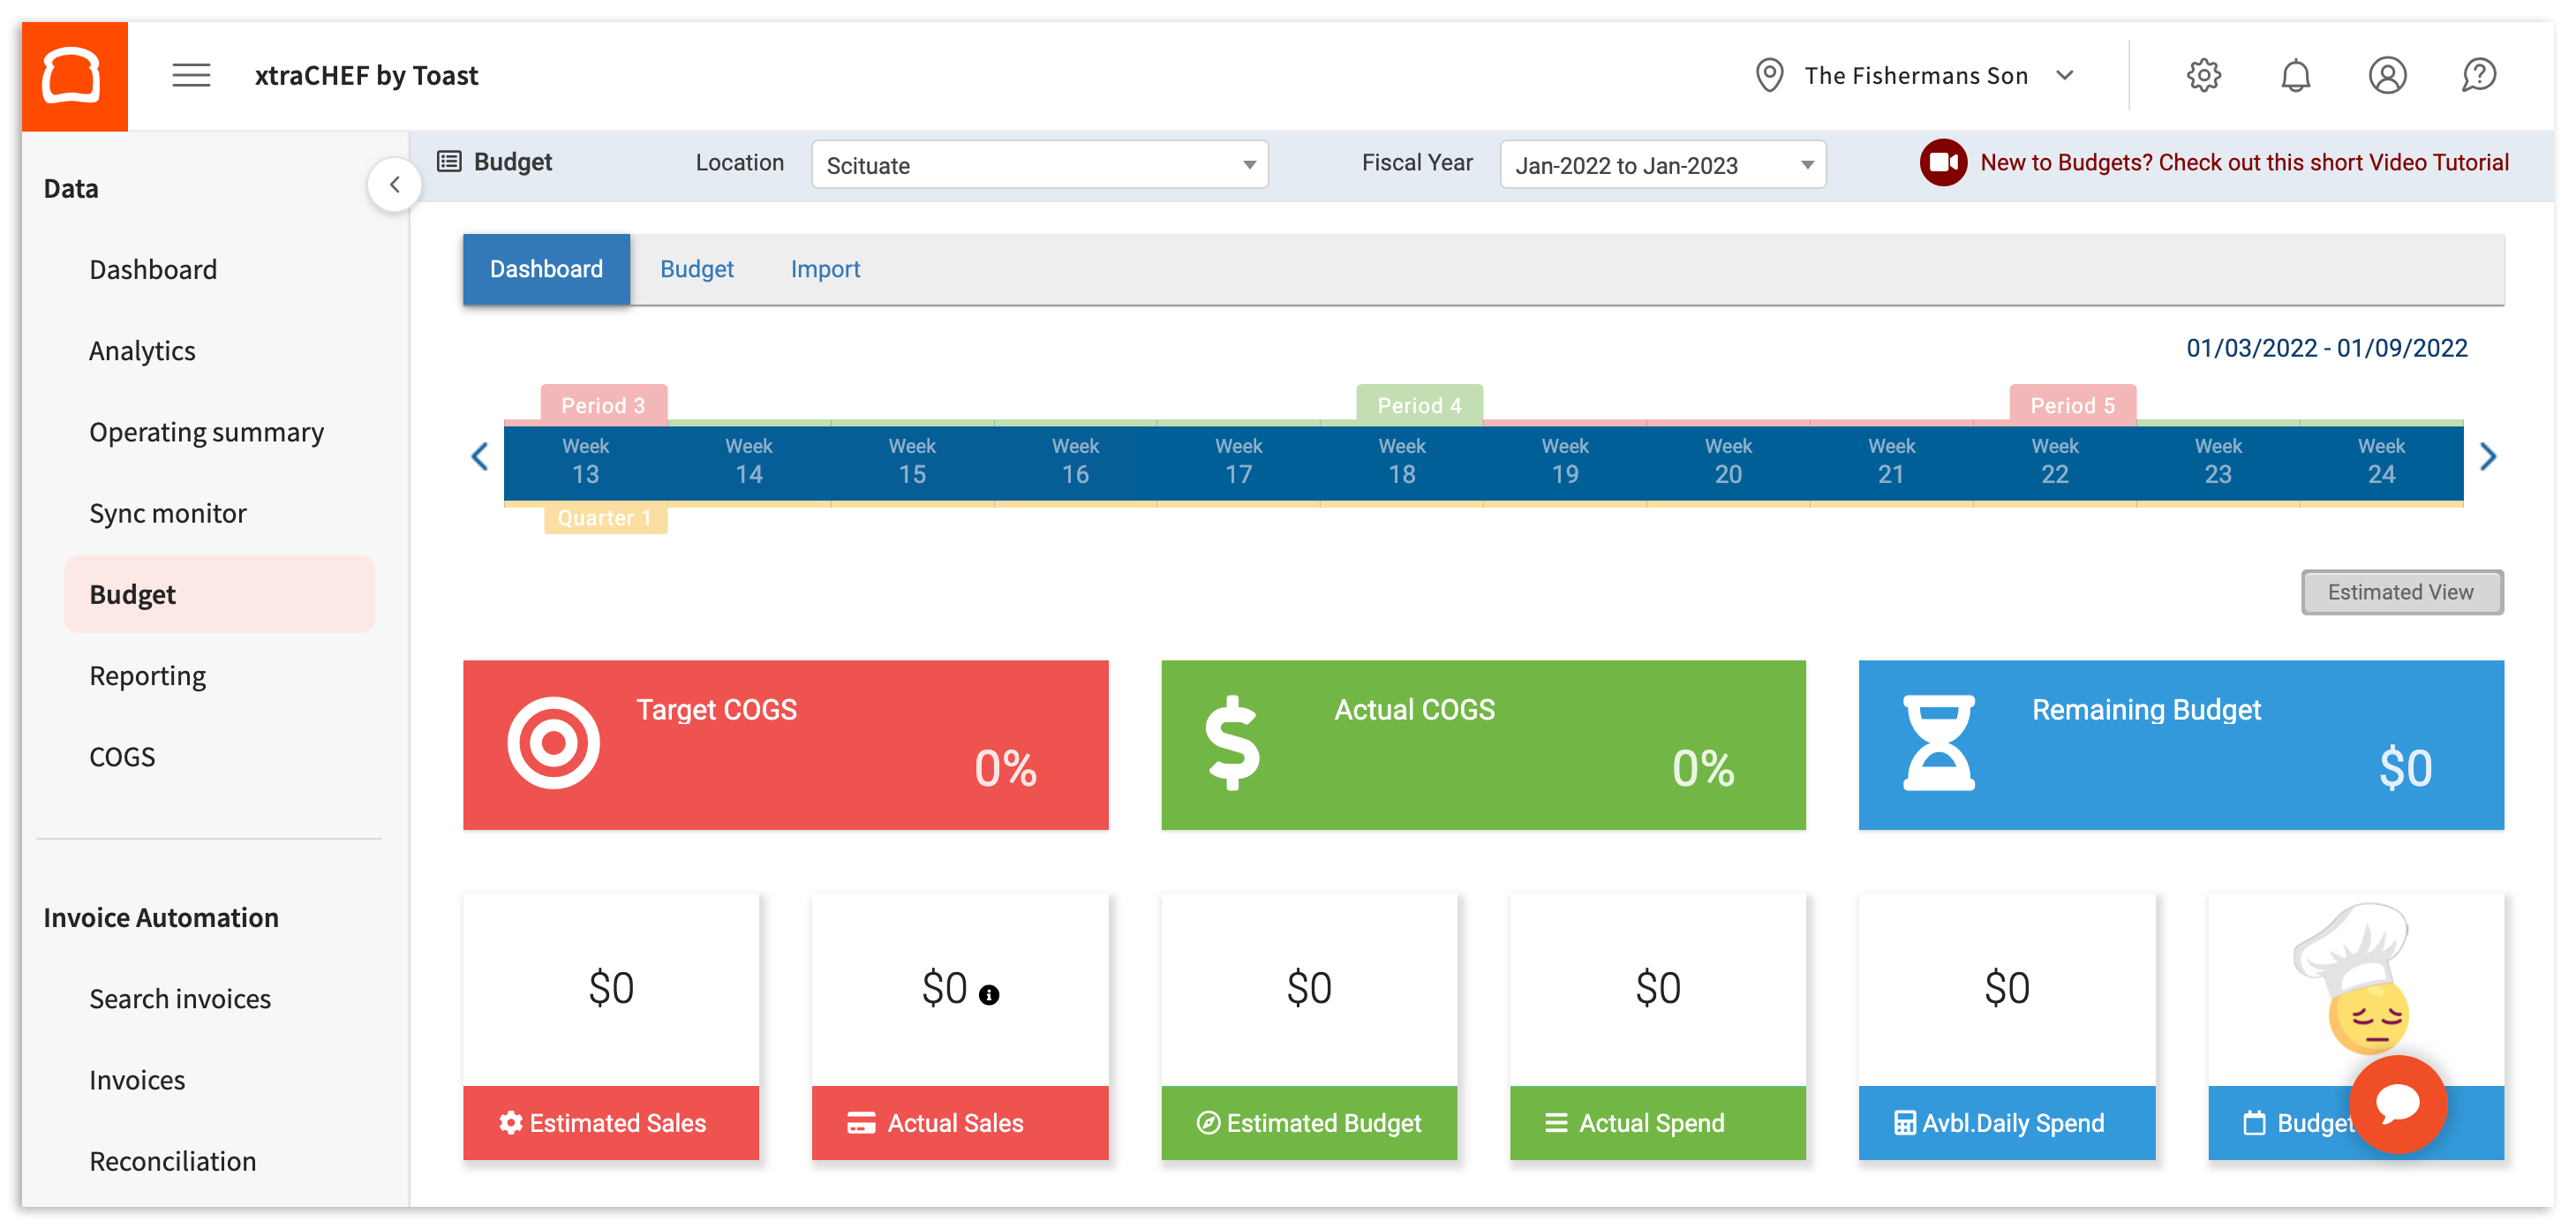
要获取有关您的支出和整体预算健康状况的见解,请导航到预算页面中的仪表板选项卡。
仪表板的默认显示为当前会计期间和您最近查看的位置。为了确保您查看的是正确的数据,请务必从页面顶部的下拉菜单中选择您的位置和您希望查看的财政年度。
在这里,您可以通过下降视图(默认)或估计视图来查看仪表板,使用屏幕右上角的滑块(如下图所示)。
见解细分
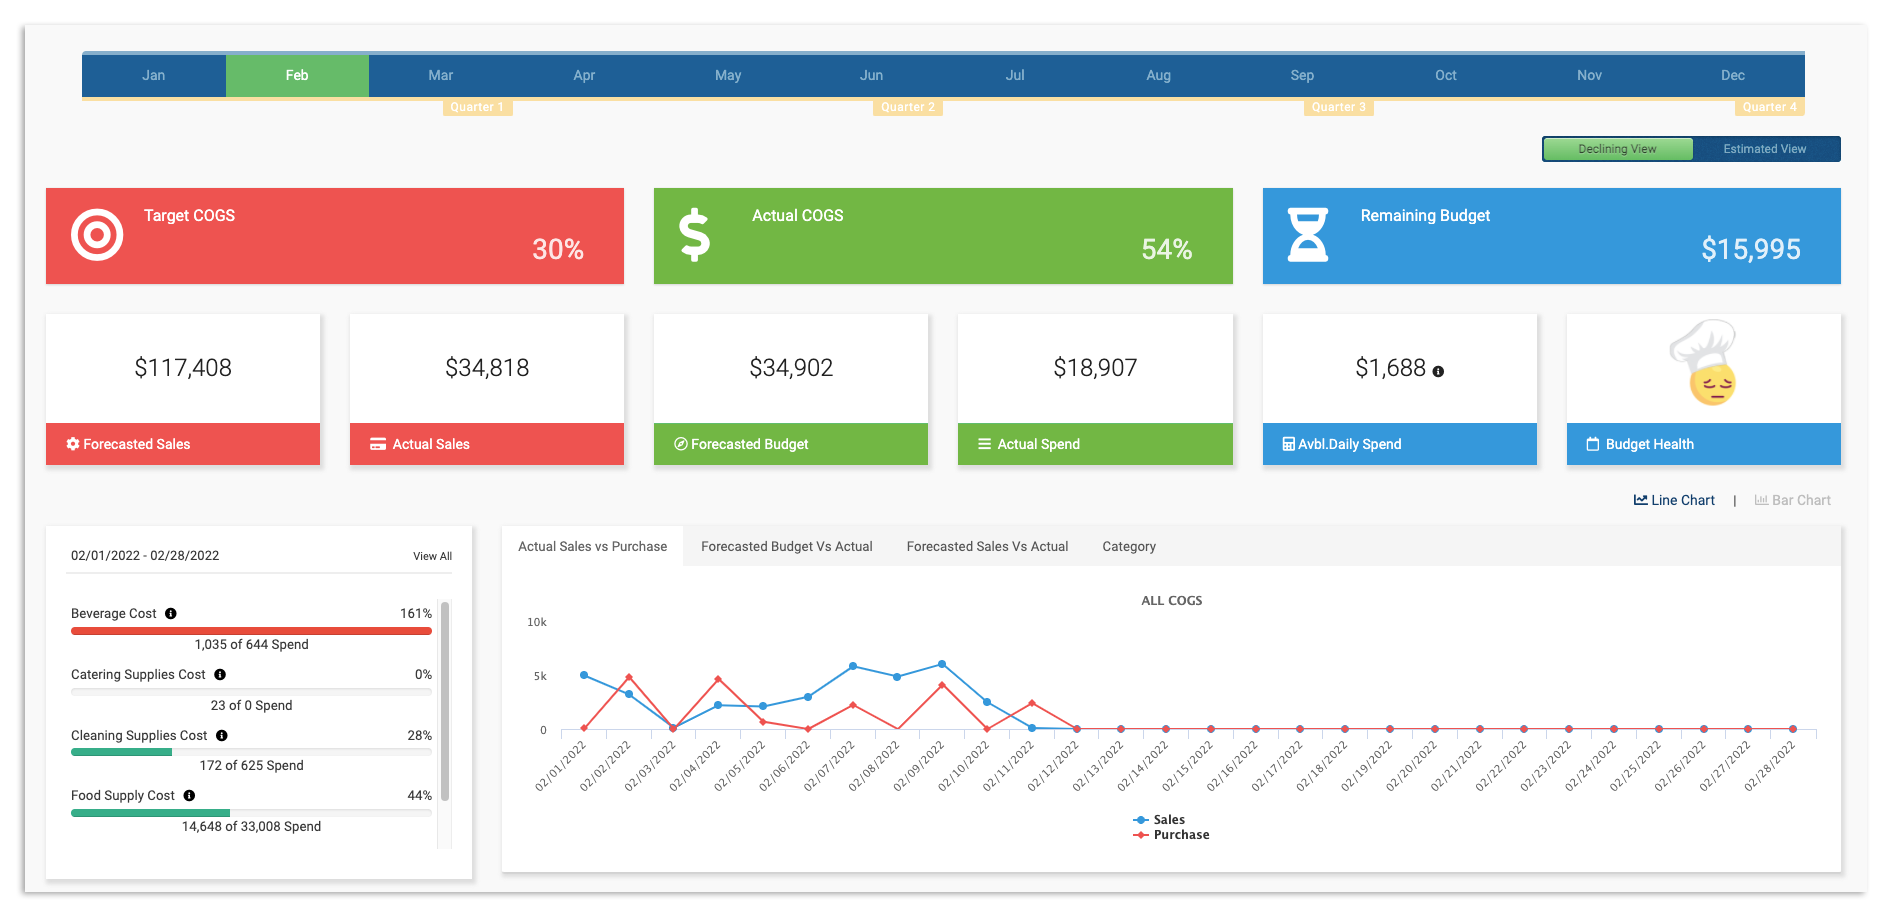
仪表板上的第一行见解包括目标销售成本、实际销售成本和剩余预算。
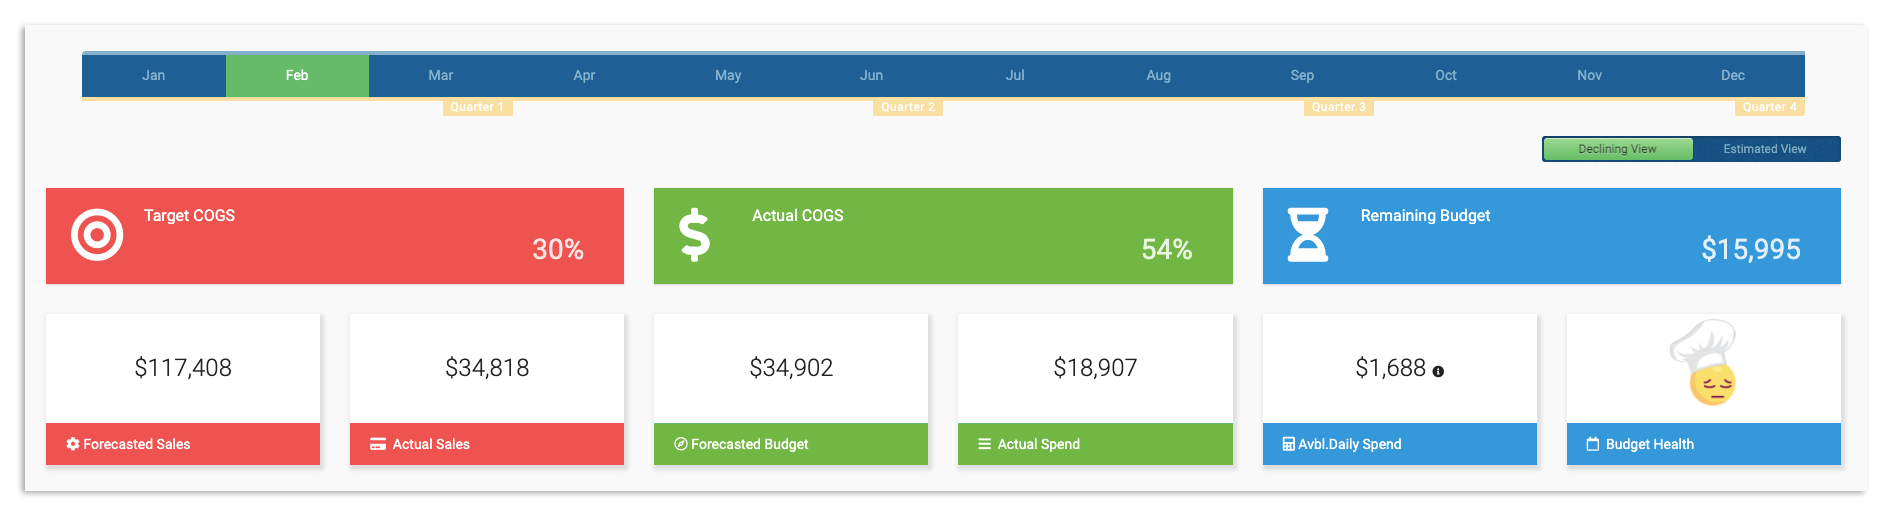
让我们深入了解这些见解及其在下表中的定义。
| 仪表板工具 | 定义 |
| 目标销售成本 | 您的预计销售额与实际销售额之间的比较百分比。 |
| 预计销售额 | 您每个期间的预计销售额,如在您的预算选项卡中确定的。 |
| 实际销售额 | 您每个期间的实际销售额,如从您的Toast POS读取的销售总额所确定的。 |
| 实际销售成本 | 您预测预算与实际支出之间的比较百分比。 |
| 预计预算 | 您每个周期的预算,根据您的预算选项卡以及基于您的销售成本估算总额和目标销售成本(%)百分比确定。 |
| 实际支出 | 您每个周期的支出,根据上传和对账的发票总额确定。专业提示:为了确保此金额100%准确,我们建议将所有账单和应付款项上传到您的xtraCHEF账户。 |
| 剩余预算 | 您预计预算与实际支出之间的差额。 |
| 可用。每日支出 | 按天计算的剩余预算值,通过将您的剩余预算与剩余天数进行比较确定。 |
第二排工具包括您的成本细分和线/柱状图(以不同方式显示相同的信息)。
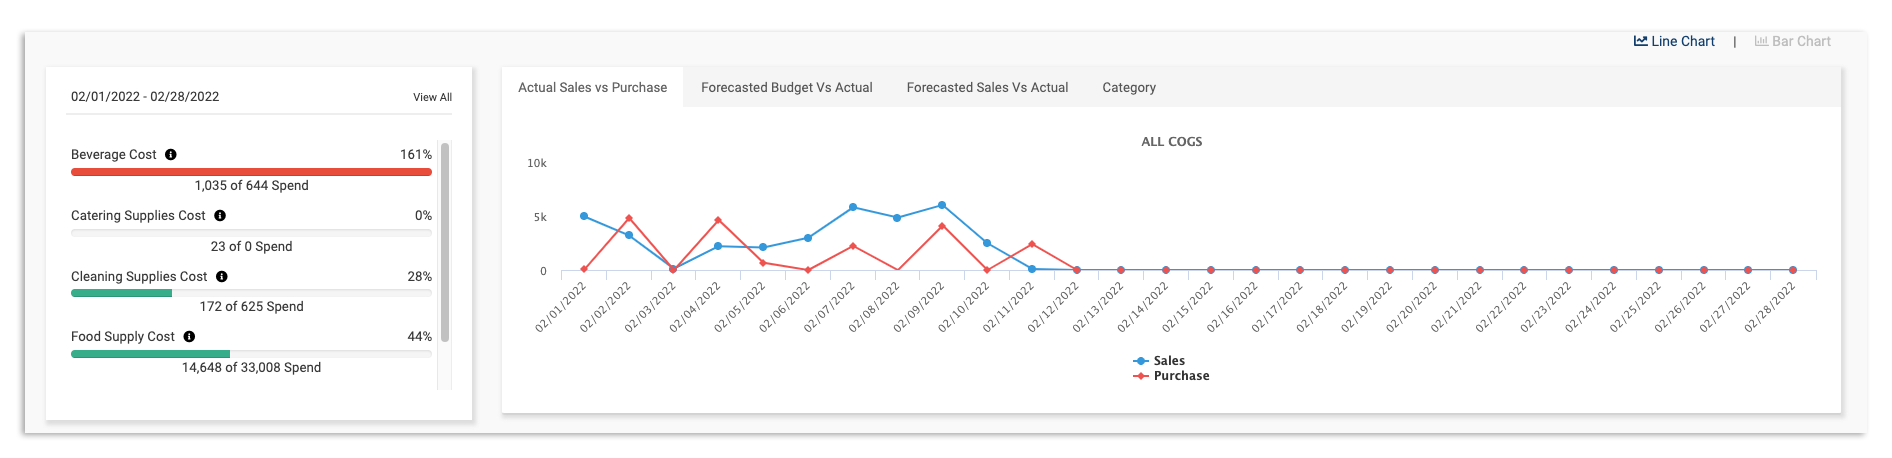
让我们深入了解这些见解及其在下表中的定义。
| 仪表板工具 | 定义 |
| 销售成本组成本 | 您按销售成本组的成本细分,通过将您的目标销售成本百分比与您每个周期的当前支出按销售成本进行比较确定。 |
| 实际销售与采购图表 | 一个比较和可视化(线图或柱状图),比较您的实际销售(从Toast POS同步)与您的实际采购(从上传和对账的发票中读取)。 |
| 预计预算与实际 | 一个比较和可视化(线图或柱状图),比较您每个周期的预计预算(在您的预算选项卡中确定)与您的实际支出(从对账的发票中读取)。 |
| 预计销售与实际销售 | 一个比较和可视化(线图或柱状图),将您的预计销售(在您的预算标签中确定)与您的实际销售(从Toast POS同步)进行比较 |
| 类别 | 一个比较和图表,显示您的总支出(从上传和对账的发票中读取)和按类别的成本比例 |
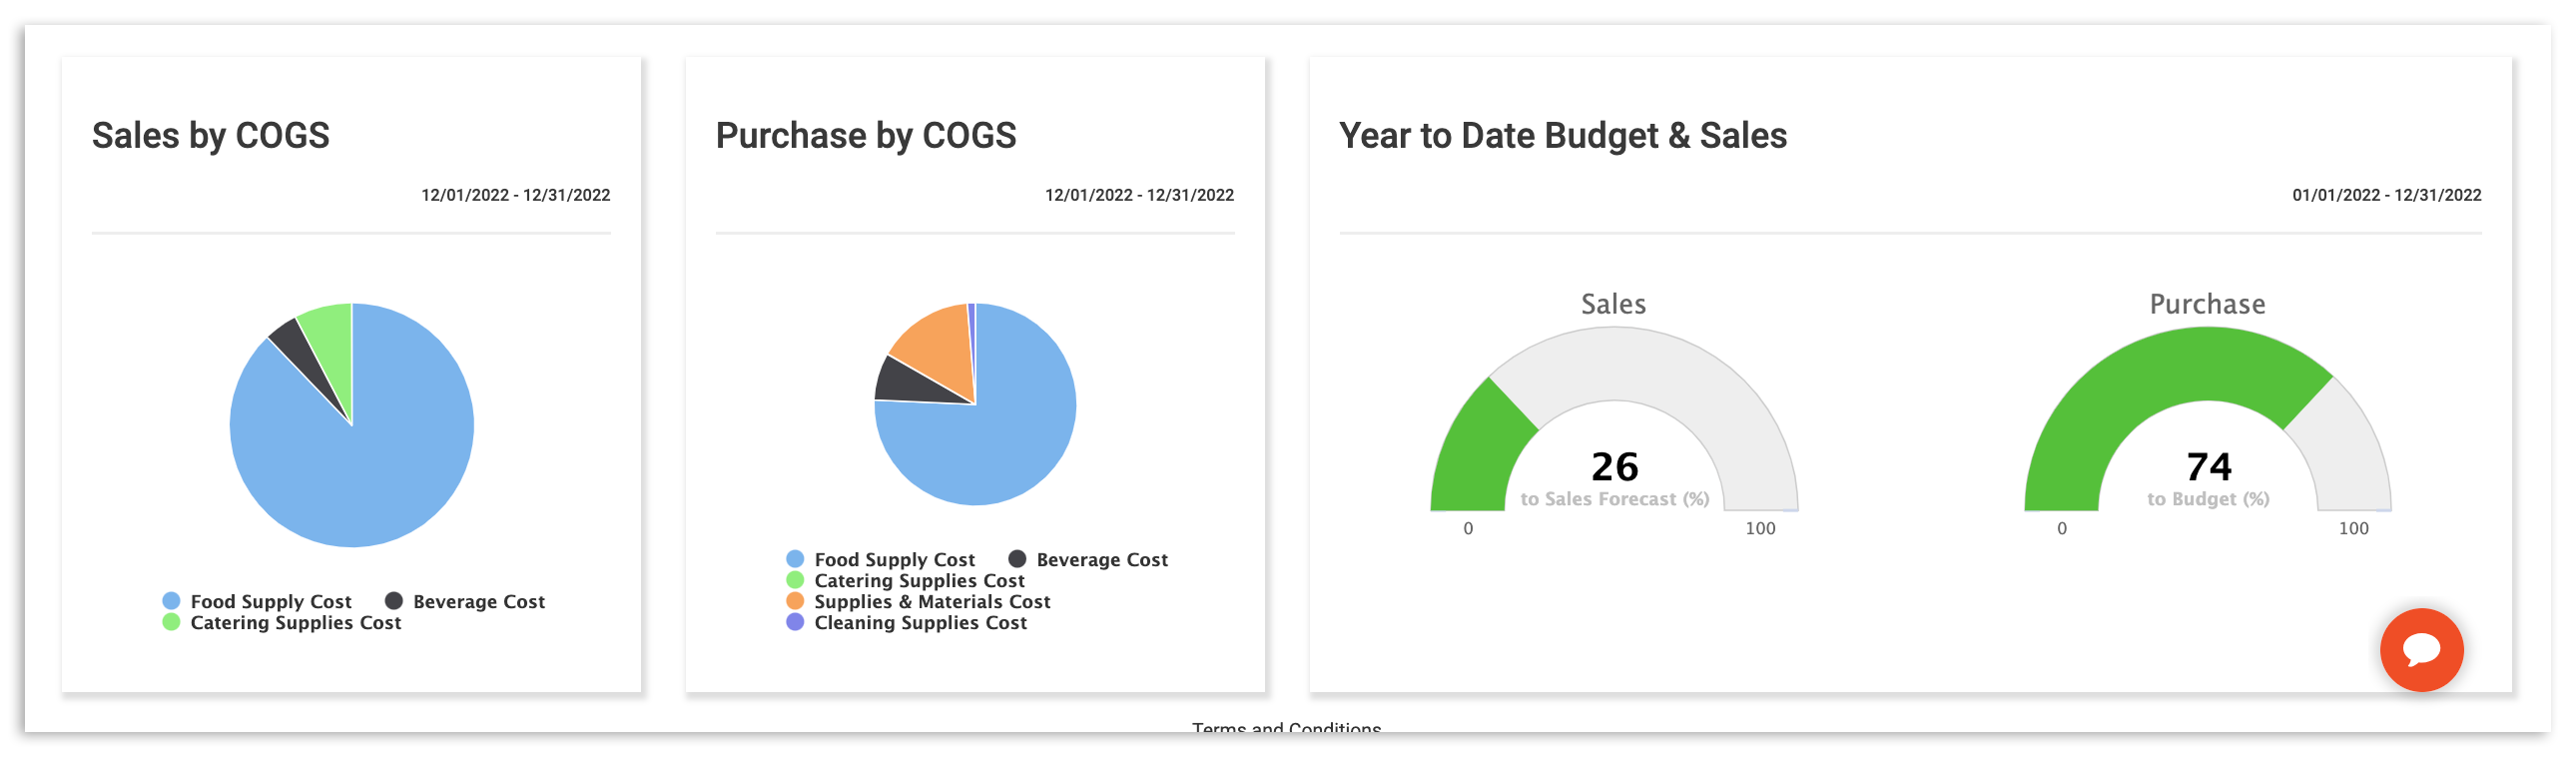
您的预算仪表板上的其他图表包括按COGS销售、按COGS采购和您的年初至今预算与销售。